
Figures & data
Table 1. Effect of different doses of β-aescin administration on % change in body weight (g) and relative liver weight (g) after CCl4 challenge. Values are expressed as mean ± SD.
Table 2. Effect of different doses of β-aescin administration on serum ALT, AST, ALP, total bilirubin and direct bilirubin after CCl4 challenge. Values are expressed as mean ± SD.
Figure 1. Effect of different doses of β-aescin administration on tissue collagen level after CCl4 challenge. Values are expressed mean ± SD. ap < 0.05 as compared with normal control and bp < 0.05 as compared with CCl4 control.
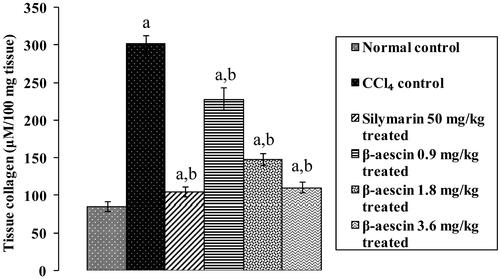
Figure 2. Effect of different doses of β-aescin administration on serum TGF-β1 after CCl4 challenge. Values are expressed mean ± SD. ap < 0.05 as compared with normal control and bp < 0.05 as compared with CCl4 control and cp < 0.05 as compared with silymarin 50 mg/kg treated.
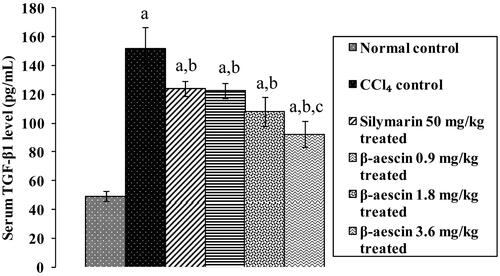
Figure 3. Effect of different doses of β-aescin administration on tissue nitrite/nitrate level after CCl4 challenge. Values are expressed mean ± SD. ap < 0.05 as compared with normal control and bp < 0.05 as compared with CCl4 control.
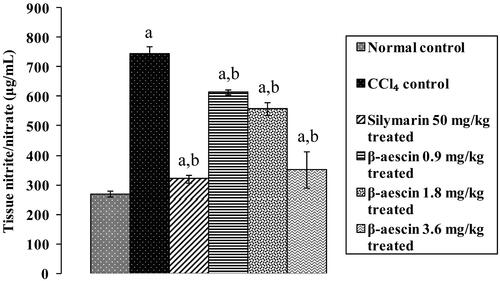
Figure 4. Effect of different doses of β-aescin administration on TBARS level after CCl4 challenge. Values are expressed mean ± SD. ap < 0.05 as compared with normal control and bp < 0.05 as compared with CCl4 control.
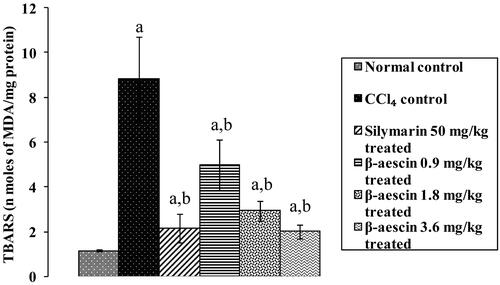
Figure 5. Effect of different doses of β-aescin administration on hepatic GSH level after CCl4 challenge. Values are expressed mean ± SD. ap < 0.05 as compared with normal control and bp < 0.05 as compared with CCl4 control.
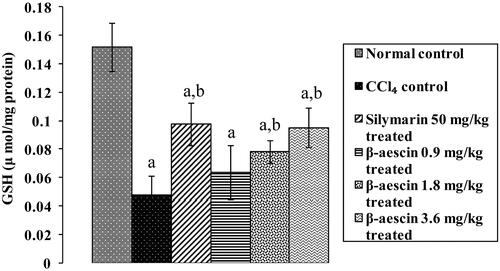
Figure 6. Effect of different doses of β-aescin administration on serum TNF-α after CCl4 challenge. Values are expressed mean ± SD. ap < 0.05 as compared with normal control and bp < 0.05 as compared with CCl4 control and cp < 0.05 as compared with silymarin 50 mg/kg treated.
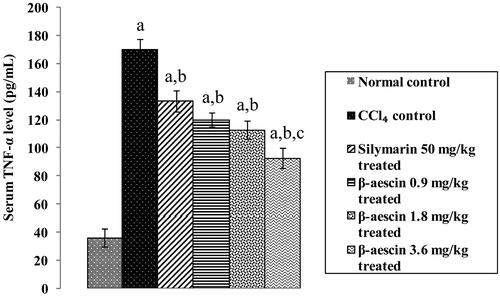
Figure 7. Representation of histopathological changes in livers obtained from rat groups at (H&E, ×100) (A) Normal control; (B) CCl4 control; (C) silymarin 50 mg/kg treated; (D) β-aescin 0.9 mg/kg treated; (E) β-aescin 1.8 mg/kg treated; (F) β-aescin 3.6 mg/kg treated.
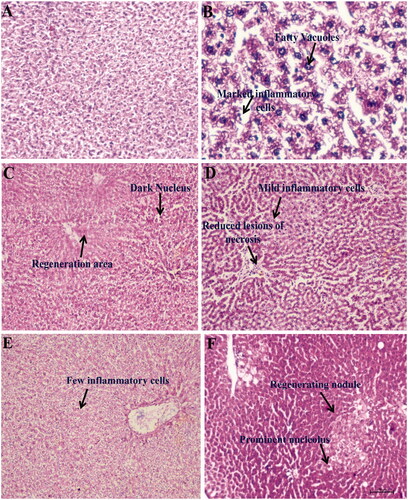
Table 3. Histopathological changes in liver of rats treated with β-aescin.