
Figures & data
Table 1. Extract yield and total flavonoids, phenolic and tannin contents from Urtica urens extracts.
Figure 1. Antioxidant capacity of ethanol and aqueous extracts of Urtica urens by the DPPH• method at different concentrations. BHT and ascorbic acid (Vitamin C) were used as positive control. Values are means ± SEM (n = 3).
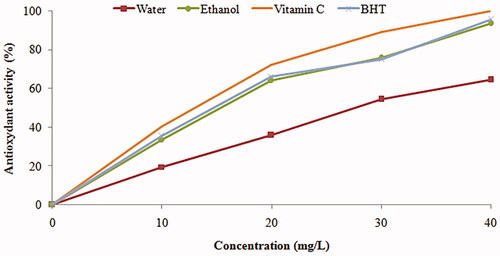
Table 2. Antioxidant activity of Urtica urens extracts (ABTS•+, DPPH•).
Figure 2. ABTS (TEAC) activities of Urtica urens extracts. Values are means ± SEM (n = 3). ***p < 0.001.
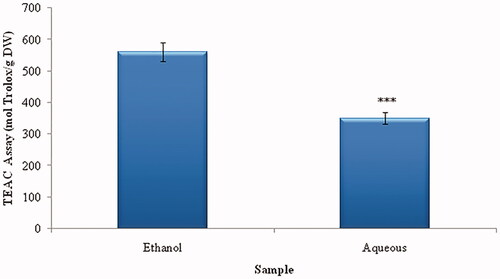
Figure 3. β-Carotene bleaching percentage of Urtica urens extracts. Values are means ± SEM (n = 3). ***p < 0.001. α: compared to BHT (control); β: compared to Ascorbic Acid; £: compared to Ethanol.
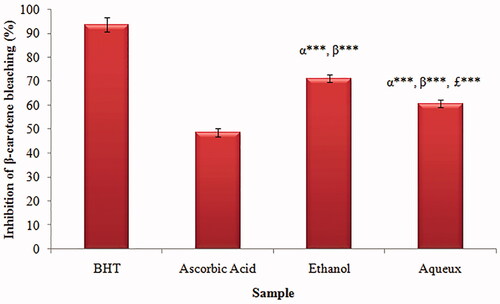
Figure 4. FRAP activities in ethanol and water extracts of Urtica urens. Values represent means ± SEM (n = 3). ***p < 0.001. α: compared to BHT; β: compared to Ethanol.
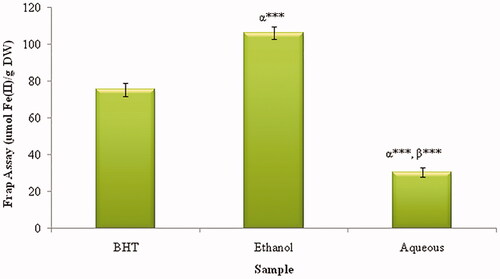
Table 3. Rapport MBC/MIC.
Table 4. Levels of vitamins D, C and E in Urtica urens leaves.