
Figures & data
Figure 1. Relative percentages of fatty acids (A) levels of SFA, MUFA and PUFA (B), and levels of tocols (C) in CPO.
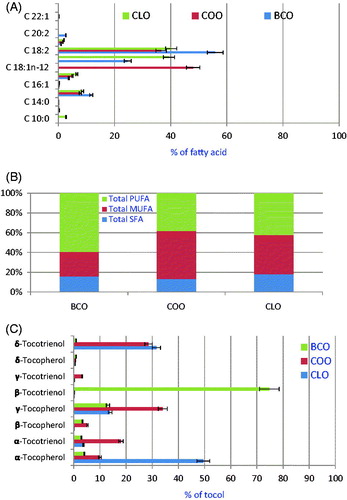
Table 1. Effect of oral administration of indomethacin and CPO on paw volume and ulcerogenicity (4 h post-injection of carrageenan-induced rat paw edema) in the adult female albino rats.
Figure 2. Liver of rat treated with (A) indomethacin showing cytoplasmic vacuolation of hepatocytes (small arrow), small focal hepatic necrosis associated with inflammatory cells infiltration (large arrow) and Kupffer cells activation (arrow head). (B) Indomethacin showing cytoplasmic vacuolation of hepatocytes (small arrow) and sinusoidal leukocytosis (large arrow). (C) BCO showing cytoplasmic vacuolization of hepatocytes (arrows) and Kupffer cells activation (large arrow). (D) COO showing Kupffer cells activation (small arrow) and sinusoidal leukocytosis (large arrow). (E) CLO showing slight activation of Kupffer cells (arrow). (F) Control showing the normal histological structure of hepatic lobule. (H & E x 400).

Figure 3. Kidney of rat treated with (A) indomethacin showing vacuolization of epithelial lining renal tubules (arrow). (B) Indomethacin showing congestion of intertubular blood vessels and glomerular tuft (small arrow) and pyknosis of the nuclei of renal tubular epithelium (large arrow). (C) BCO showing dilatation and congestion of renal blood vessel (arrow). (D) COO showing vacuolation of epithelial lining renal tubules (arrows). (E) CLO showing no histopathological changes. (F) Control showing the normal histological structure of renal parenchyma. (H & E x 400).
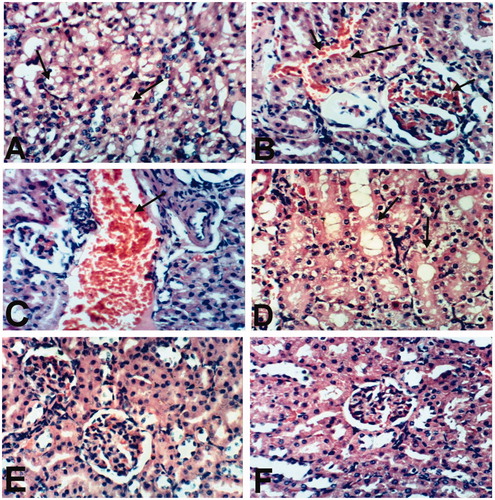
Figure 4. Heart of rat treated with (A) Indomethacin showing congestion of myocardial blood vessel (small arrow) and few mononuclear inflammatory cells infiltration (large arrow). (B) BCO showing slight congestion of myocardial blood capillaries (arrow). COO (C), CLO (D) and control (E) showing no histopathological changes (H & E x 400).
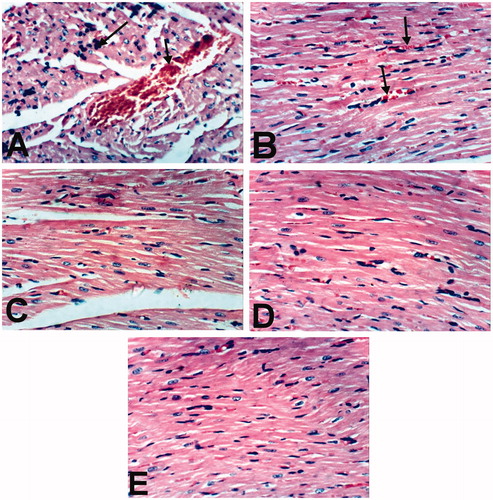
Figure 5. Spleen of rats treated with indomethacin (A), BCO (B), COO (C), CLO (D), and control (E) showing no histopathological changes (H & E x 400).
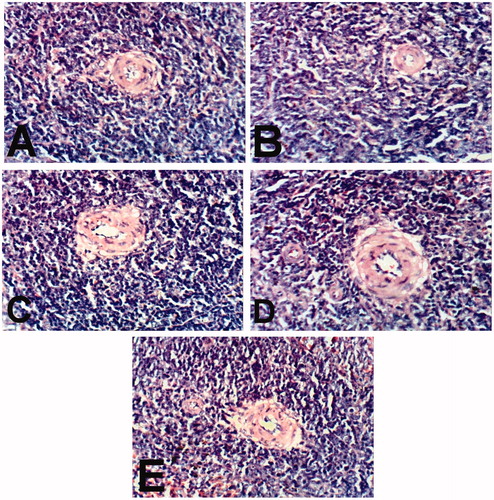
Figure 6. Stomach of rat treated with (A) indomethacin showing focal necrosis of gastric mucosa (small arrow) and submucosal edema (large arrow). BCO (B), COO (C), CLO (D), and control (E) control showing no histopathological changes (H & E x 100).
