Figures & data
Figure 1. Chemical structure of ADTA.
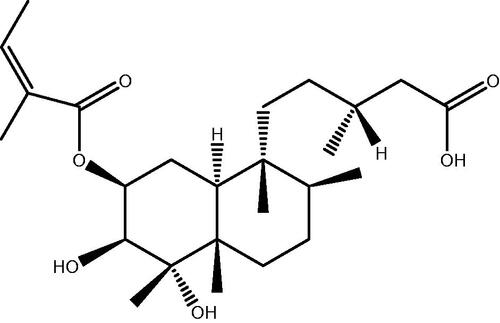
Table 1. Cytotoxic activity of ADTA on human cancer and non-tumorigenic cells.
Figure 2. ADTA induces anti-inflammatory effects in vitro. The amount of NO production (A), phagocytic activity (B), H2O2 release (C) and the production of IL-6 (D) and TNF-α (E) were measured as described in ‘Materials and methods’ section. Data are representative of three independent experiments in hexaplicate. Results represent the mean ± standard deviation. *denotes p ≤ 0.05, compared to LPS treatment.
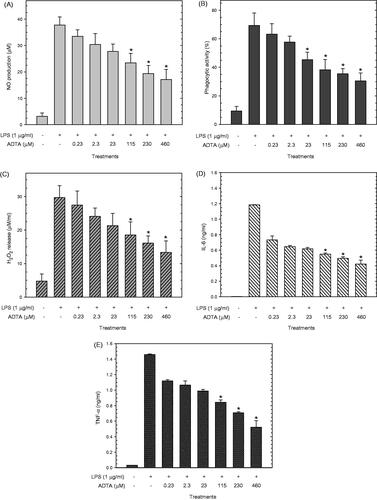
Figure 3. ADTA exerts antinociceptive effects. The antinociceptive effects of ADTA (25–100 mg/kg p.o.) were evaluated using the nociceptive tests acetic acid (A) and formalin (B). Other groups of mice received 100 mg/kg of NPX as the positive control or the vehicle (saline solution). Data are representative of two independent experiments (n = 8). Results represent the mean ± standard error (SE). **denotes p ≤ 0.05, compared to the vehicle group.
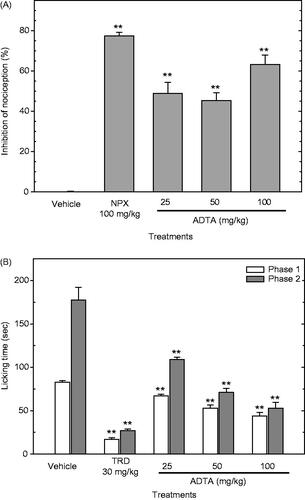
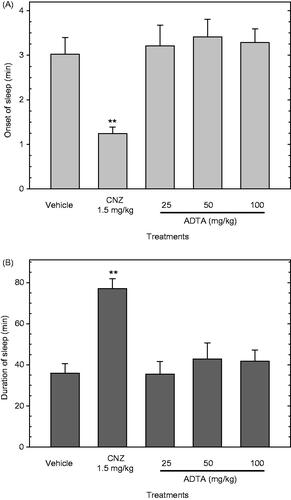
Figure 4. Effects of ADTA on the sedation of mice. The sedative effects of ADTA (25–100 mg/kg p.o.) were evaluated using the ketamine-induced sleeping time test recording the onset of sleep (A) and the duration of sleep (B). Other groups of mice received 1.5 mg/kg of clonazepam (CNZ) as the positive control or the vehicle (saline solution). Data are representative of two independent experiments (n = 8). Results represent the mean ± standard error (SE). **denotes p ≤ 0.05, compared to the vehicle group.