
Figures & data
Table 1. Mineral content of N. retusa fruit.
Figure 1. HPLC–HRMS chromatogram representing the polyphenols extracted from the aqueous extract of N. retusa fruit and chemical structure of the major components identified [hydroxycaffeic acid (1), 3-O-methylgallic acid (2), p-coumaric acid (3), 3′-O-methyl-(-)-epicatechin 7-O-glucuronide (4), 4′-O-methyl-(-)-epicatechin 3′-O-glucuronide (5), epicatechin 3′-O-glucuronide (6), taxifoline (7), kaempferol (8), cyanidin 3-O-rutinoside (9), chlorogenic acid (10) and kaempferol 3-glucoside (11)]. The identification was performed according to a home-generated database containing 500 compounds and a mixture of standards containing 30 phenolic compounds.
![Figure 1. HPLC–HRMS chromatogram representing the polyphenols extracted from the aqueous extract of N. retusa fruit and chemical structure of the major components identified [hydroxycaffeic acid (1), 3-O-methylgallic acid (2), p-coumaric acid (3), 3′-O-methyl-(-)-epicatechin 7-O-glucuronide (4), 4′-O-methyl-(-)-epicatechin 3′-O-glucuronide (5), epicatechin 3′-O-glucuronide (6), taxifoline (7), kaempferol (8), cyanidin 3-O-rutinoside (9), chlorogenic acid (10) and kaempferol 3-glucoside (11)]. The identification was performed according to a home-generated database containing 500 compounds and a mixture of standards containing 30 phenolic compounds.](/cms/asset/f2793fdf-efcb-4c3d-a9b9-57d81baba0ba/iphb_a_1278455_f0001_c.jpg)
Table 2. Body, absolute and relative kidney weights. Food and water intake of control and treated rats with penconazole (PEN), N. retusa aqueous extract (NRE), or their combination (NRE + PEN).
Table 3. Urinary volume, creatinine clearance, plasma and urinary levels of creatinine, urea and uric acid, and BUN of control and treated rats with penconazole (PEN), N. retusa aqueous extract (NRE) or their combination (NRE + PEN).
Table 4. Plasma ALP, GGT and LDH activities and kidney LDH activity in control and treated rats with penconazole (PEN), N. retusa aqueous extract (NRE) or their combination (NRE + PEN).
Table 5. Kidney MDA, H2O2, PCO, AOPP, NPSH, GSH and MT levels in control and treated rats with penconazole (PEN), N. retusa aqueous extract (NRE) or their combination (NRE + PEN).
Figure 2. Antioxidant enzyme activities (A) CAT, (B) SOD and (C) GPx in kidney of control and treated rats with penconazole (PEN), N. retusa aqueous extract along with penconazole (NRE + PEN) and N. retusa aqueous extract (NRE). Values are means ± SD for six rats in each group. PEN and NRE + PEN groups vs control group: *p < 0.05; **p < 0.01; ***p < 0.001. NRE + PEN group vs PEN group: #p < 0.05; ##p < 0.01; ###p < 0.001
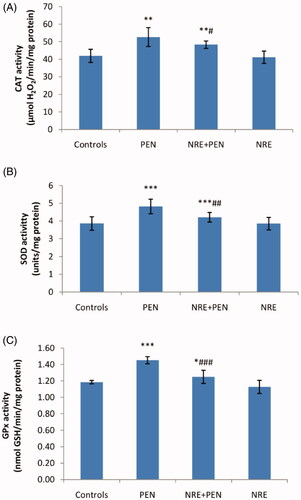
Figure 3. Histological kidney sections of (A) control and (B1, B2 and B3) treated rats with penconazole, (C) N. retusa aqueous extract along with penconazole and (D) N. retusa aqueous extract. Optic microscopy: H&E (400×). Arrows indicate: Glomeruli fragmentation, necrosis of the epithelial cells lining the tubules, Bowman’s space enlargement, inflammatory leucocytes infiltration
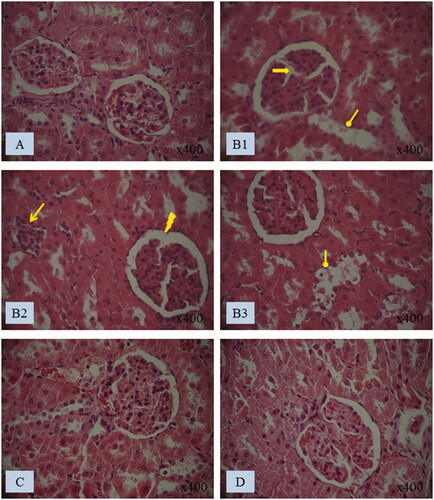
Table 6. Grading of the histopathological changes in the kidney sections.