Figures & data
Figure 1. Effect of screening of various doses of extract on systolic blood pressure (mmHg), mean blood pressure and diastolic blood pressure in normotensive rats. The results are stated as Mean ± SEM, where c = (p < 0.05), a = (p < 0.001) vs. control (0 h).
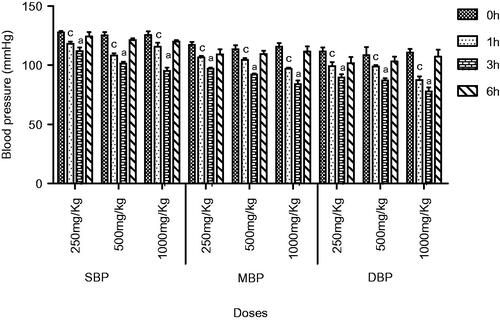
Figure 2. Effect of screening of various doses of extract on heart rate of normotensive rats, where, *** = (p < 0.001), and ns = non-significant vs. control (0 h).
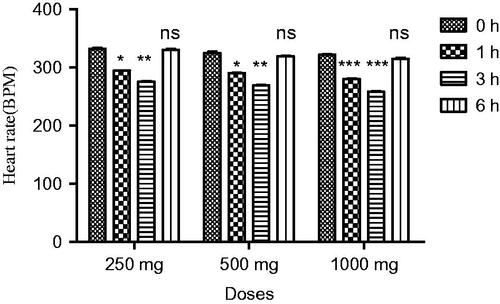
Figure 3. Effect of extract on SBP,MBP and DBP of normotensive rats. Results are presented as Mean ± SEM where c = (p < 0.05), b = (p < 0.01) and a = (p < 0.001) vs. control.
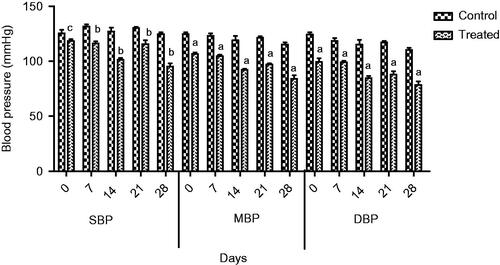
Figure 4. Effect of extract on heart rate of normotensive rats, where ** = (p < 0.01) vs. control.
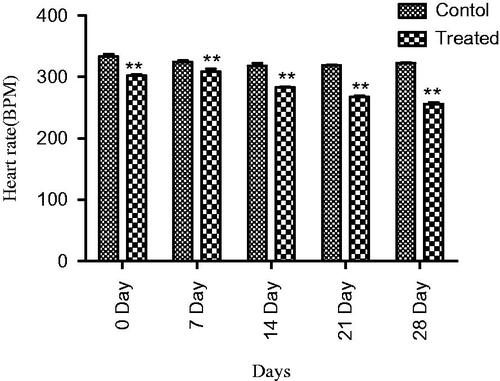
Figure 5. Effect of extract on SBP, MBP and DBP of glucose treated hypertensive rats. Where c = (p < 0.05) and a = (p < 0.001) vs. control.
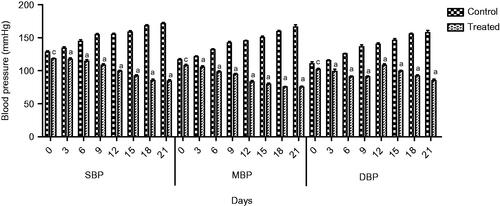
Figure 6. Effect of extract on heart rate of glucose treated hypertensive rats, where * = (p < 0.05), and *** = (p < 0.001) vs. control.
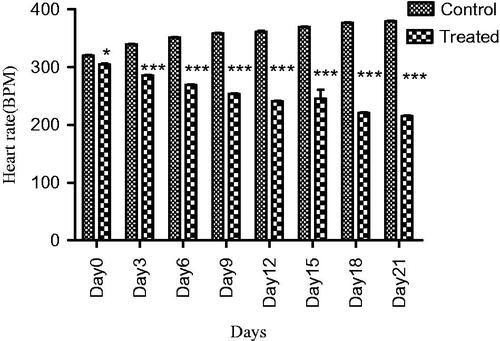
Table 1. Effect of aqueous-methanolic extract of Ficus carica fruit on various cardiac parameters of isolated rabbit heart.
Figure 7. Effect of extract on DPPH scavenging activity. Where * = (p < 0.05) vs. ascorbic acid.
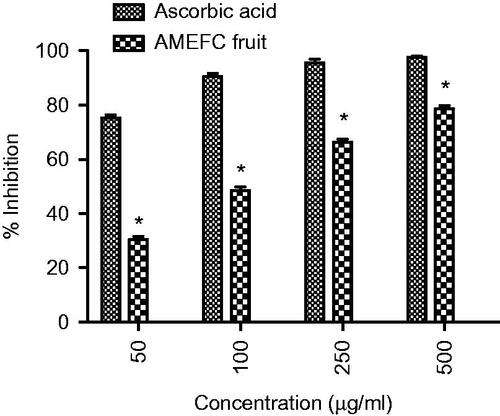
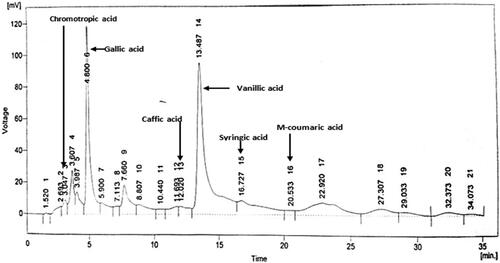
Figure 8. Chromatogram presenting compounds in AMEFC fruit at 280 nm.