Figures & data
Figure 1. Effect of TGSBE on LPS-induced NO production and iNOS expression in RAW264.7 cells. (a) cells were treated with indicated concentrations of TGSBE for 1 h, followed by LPS (0.5 μg/mL) for 24 h. Afterwards, cell-free supernatant was collected and the amount of NO was quantified by Griess method using a standard solution of sodium nitrite prepared in the same cell-culture medium. (b) the mRNA levels of iNOS was determined by RT-PCR. (c) Whole cell lysates were subjected to SDS-PAGE and the protein levels of iNOS was determined by Immuno-blot analysis. Data represent mean ± SD from three separate experiments. *p < 0.05, significant compared to control, #p < 0.05, significant compared to LPS alone treated group.
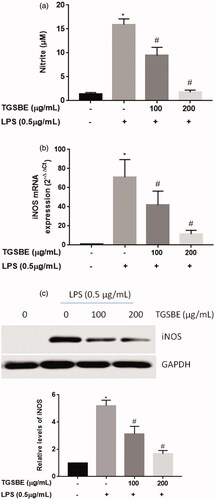
Figure 2. Effect of TGSBE on LPS-induced cytokine production in RAW264.7 cells. The cells were treated with indicated concentrations of TGSBE for 1 h, followed by LPS (0.5 μg/mL) for 24 h. Then, cell-free supernatant was subjected to quantify TNFα, IL-6 and IL-1β levels, using ELISA kits, according to manufacturer’s protocol. Data represent mean ± SD from three separate experiments. *p < 0.05, significant compared to control, #p < 0.05, significant compared to LPS alone treated group.
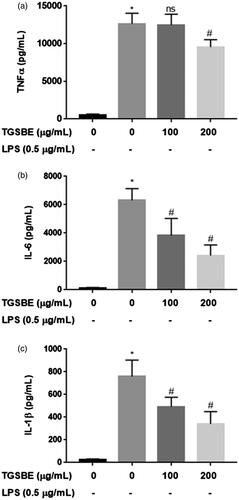
Figure 3. Effect of TGSBE on LPS-induced mRNA expression of TNFα, IL-6 and IL-1β in RAW264.7 cells. The cells were pre-incubated with indicated concentrations of TGSBE for 1 h, followed by LPS (0.5 μg/mL) for 12 h. Then, total RNA was extracted and mRNA expression of TNFα, IL-6 and IL-1β was analyzed by real-time RT-PCR. Data represent mean ± SD from three separate experiments. *p < 0.05, significant compared to control, #p < 0.05, significant compared to LPS alone treated group.
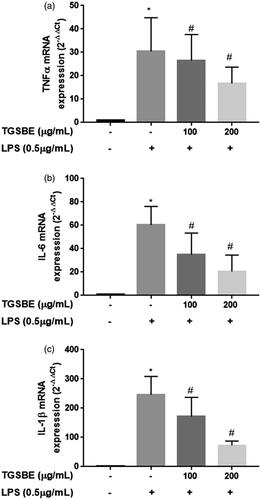
Figure 4. Effect of TGSBE on LPS-induced nuclear translocation of NF-κB p65 in RAW264.7 cells. (a) Cells were pretreated with indicated concentrations of TGSBE for 12 h, prior to stimulation of LPS (0.5 μg/mL) for 30 min. Nuclear fractions were collected and subjected to immunoblotting of NF-κB p65, Lamin-B and GAPDH. (b) The translocation of NF-κB p65 to the nucleus was analyzed by confocal microscopy. After treatment, cells were permeabilized and immunostained with NF-κB p65 for overnight. Followed by conjugation with FITC tagged secondary antibody and Hoechst for nucleus. Magnification, 200x. Images are representative of three separate experiments. The fluorescence of NF-κB p65 protein and nuclei is green and blue, respectively.
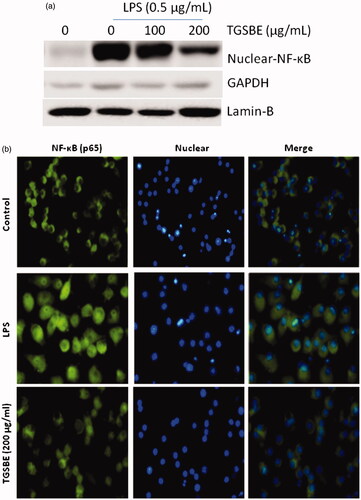
Figure 5. Effect of TGSBE on LPS-induced activation of MAPKs in RAW264.7 cells. Cells were pre-incubated with TGSBE for 12 h, followed by LPS stimulation for 30 min. Then, whole cell lystaes were prepared and used to analyze the levels of phosphorylated and non-phosphorylated p38, JNK or ERK1/2 by immune-blot assay. Blots are representative of three independent experiments.
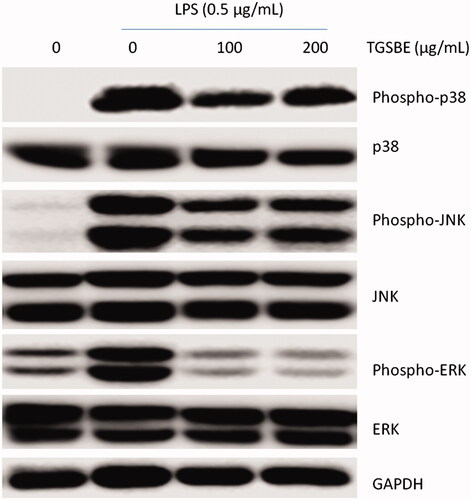
Figure 6. (a) Effect of TGSBE on LPS-induced production of ROS in RAW264.7 cells. Following treatment with TGSBE and LPS, cells were incubated with DCF-DA for 30 min. Afterwards, cells were collected and fluorescent intensity which is proportional to ROS concentration, was determined by flow-cytometry. Images are representative of three separate experiments. The relative level of ROS production was depicted in graph. Data represent mean ± SD values of three separate experiments. *p < 0.05, significant compared to control, #p < 0.05, significant compared to LPS alone treated group. (b) the antioxidant potential of TGSBE was determined by ABTS radical scavenging assay. The representative graph depicts the percentage ABTS radical scavenging potential of TGSBE and a reference standard ascorbic acid. Data represent mean ± SD values of three separate experiments.
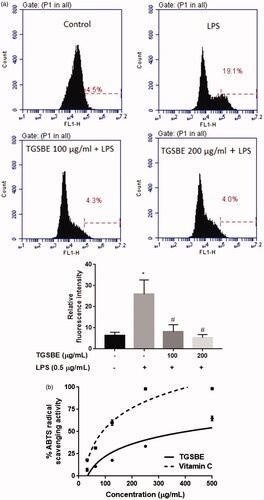
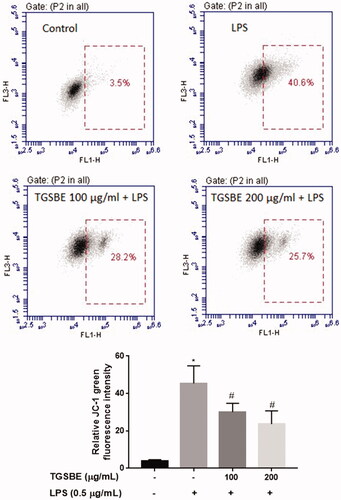
Figure 7. Effect of TGSBE on LPS-induced loss of mitochondrial membrane potential in RAW264.7 cells. Cells were pretreated or not with TGSBE for 1 h and exposed or not to LPS for 12 h. Cells were harvested and incubated with JC-1 for 15 min. After removing the excess JC-1, cells were analyzed using a flow-cytometer. Images are representative of three separate experiments. The relative level of loss of mitochondrial membrane potential was depicted in graph. Data represent mean ± SD values of three separate experiments. *p < 0.05, significant compared to control, #p < 0.05, significant compared to LPS alone treated group.