Figures & data
Table 1. Chemical composition of T. capitatus essential oil (EO).
Figure 1. Antinociceptive effect of T. capitatus EO in mice. The T. capitatus EO was administered in mice orally (3–12 mg/kg) 1 h before initiating the glutamate-induced nociception method. Control animals were treated with vehicle alone. Morphine (5 mg/kg) was used as a positive control. Values are expressed as mean ± S.E.M, n = 8. *p < 0.05, ***p < 0.001 vs. control (ANOVA followed by Dunnet’s test).
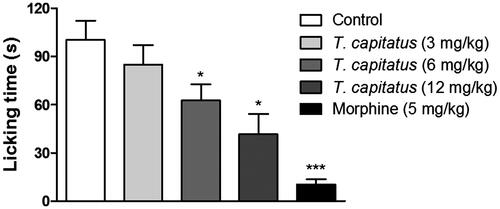
Figure 2. T. capitatus EO reversibly blocks the peripheral nerve excitability. (A) Representative CAP recordings obtained by the single sucrose gap technique after 5, 15 and 30 min of T. capitatus EO (500 μg/mL) incubation. After drug incubation, the nerve was washed out with the physiological solution for 30 min. Control records were obtained when sciatic nerves were submitted to the physiological solution only. Stimulation parameters were 6–10 V/0.1 ms. (B) Time- and concentration-dependent effects of T. capitatus EO (1–500 μg/mL) on CAP amplitude (VCAP) during 30 min incubation followed by nerve washout (30 min). Values are expressed as mean ± S.E.M, n = 4. *p < 0.05; **p < 0.01; ***p < 0.001 vs. control (Student’s t-test).
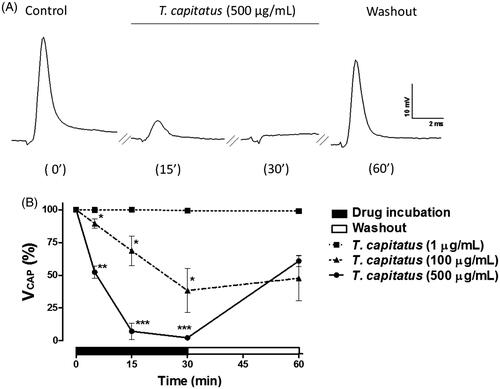
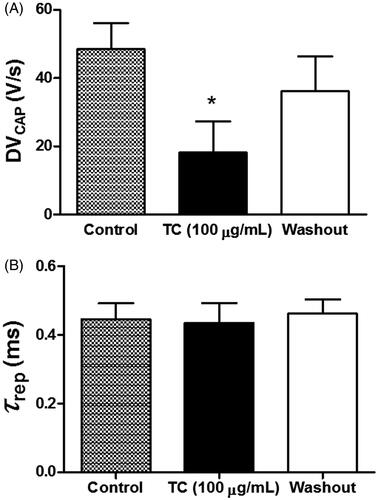
Figure 3. Effects of T. capitatus on the depolarization and repolarization phases of the CAP. T. capitatus EO (TC, 100 μg/mL) was incubated in the rat sciatic nerve for 30 min followed by drug washout out with the physiological solution. The CAP parameters like (A) the depolarization velocity (DVPAC), and (B) the time constant of repolarization (τrep), were quantified and compared to control. Values are expressed as mean ± S.E.M, n = 4. *p < 0.05 vs. control (Student’s t-test).