
Figures & data
Table 1. Effect of AMECR on formaldehyde induced arthritis in Sprague–Dawley rats.
Table 2. Effect of AMECR on turpentine oil induced arthritis in Sprague–Dawley rats.
Figure 1. Effect of AMECR on percentage inhibition of protein (egg albumin) denaturation. All the values are expressed as mean ± SEM (n = 3), using two-way ANOVA followed by the Bonferroni post-test. ***(p < 0.001) vs standard group.
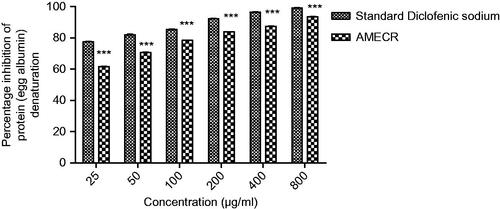
Figure 2. Effect of AMECR on percentage inhibition of protein (bovine serum albumin) denaturation. All the values are expressed as mean ± SEM (n = 3), using two-way ANOVA followed by the Bonferroni post-test. ***(p < 0.001) vs standard group.
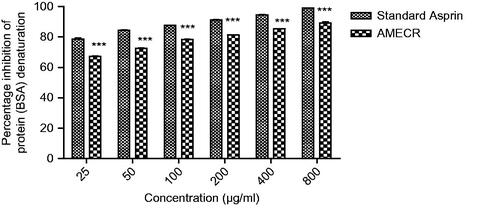
Table 3. Biochemical parameters serum urea, serum creatinine, blood urea nitrogen and serum uric acid.
Table 4. Effect of Cuscuta reflexa on kidney weight of rats.
Figure 3. Histopathological analysis of the kidneys of Sprague–Dawley rats at the 8th day of treatment after gentamicin-induced nephrotoxicity. (a) Normal control group showing normal appearance of glomeruli (G) and tubules (T). (b) Toxic control group exhibiting focal necrosis (N) and lymphatics infilterate (L). (c) 200 mg/kg AMECR group presenting moderate lymphatic infilterate (L). (d) 400 mg/kg AMECR group displaying mild lymphatic infilterate (L). (e) 600 mg/kg AMECR group revealing minute lymphatic infilterate (L).
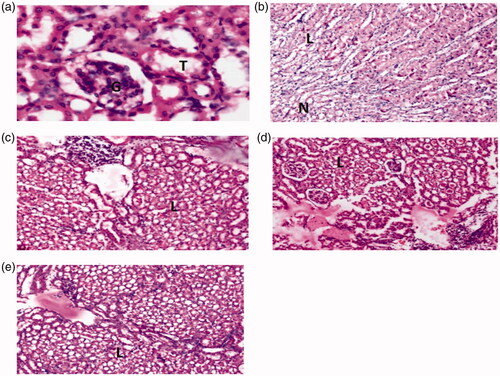
Table 5. Histopathological analysis of kidneys of gentamicin induced nephrotoxic rats.
Table 6. Preliminary phytochemical analysis of Cuscuta reflexa.
Figure 4. Peaks of phytoconstituents in HPLC analysis.
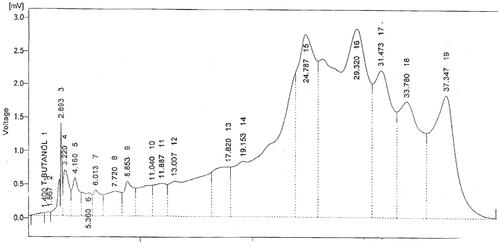
Table 7. Preliminary HPLC analysis of Cuscuta reflexa.