
Figures & data
Table 1. Percentage yield of the different extracts and fractions of E. sativa Mill.
Figure 1. Preparation of E. sativa extracts and the phytochemical fractionation of the active n-hexane extract. Values in parentheses represent the yield of the different extracts and fractions.
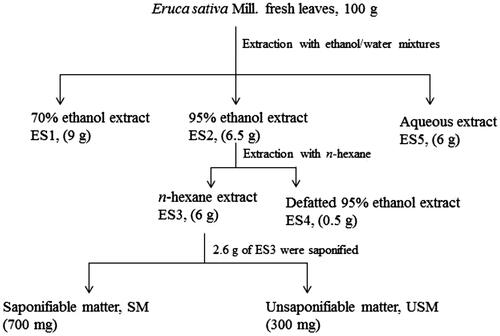
Table 2. Maximum non-toxic concentrations of E. sativa Mill. extracts and fractions (μg/mL).
Figure 2. (A) Effect of E. sativa extracts on 3H-deoxyglucose uptake in C2C12 cells following 18 h treatment with their maximum non-toxic concentrations. Cells treated with insulin (100 nm, 30 min) or metformin (400 μM, 18 h) served as the positive control. (B) and (C) are dose-response analysis of the stimulation of glucose uptake by ES3 and SM, respectively. Cells were incubated with several concentrations of ES3 (1.56, 3.12, 6.25 and 12.5 μg/mL) or SM (3.12, 6.25, 12.5 and 25 μg/mL). Data are represented as mean ± SEM of three independent experiments and are expressed as % change in the rate of basal glucose uptakes relative to the vehicle control (0.1% DMSO). *p < 0.05, **p < 0.01, ***p < 0.001 significantly different from 0.1% DMSO.
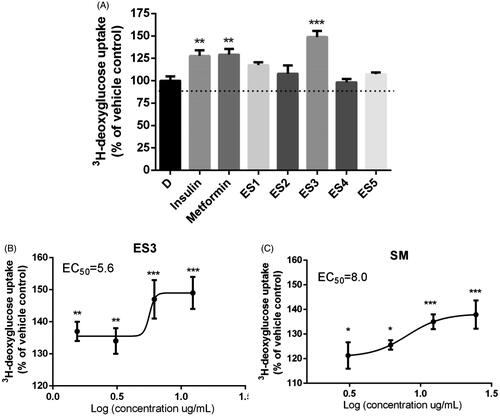
Figure 3. (A) Effect of E. sativa extracts on G6Pase activity in H4IIE hepatocytes. Cells were treated for 18 h with the maximum non-toxic concentrations of the indicated extracts. G6Pase activity was assessed colorimetrically by measuring glucose formation in the presence of a non-limiting amount of G6P as described under ‘Materials and Methods’. (B) and (C) are dose-response analysis of G6Pase inhibitory effects of ES3 and SM, respectively. Cells were separately treated with ES3 at different concentrations (1.56, 3.12, 6.25 and 12.5 μg/mL) or with SM (3.12, 6.25, 12.5 and 25 μg/mL). Data are expressed relative to vehicle control (0.1% DMSO, 0% inhibition). Cells treated with 100 nm insulin for similar time served as the positive control. Assays were carried out in triplicate.*p < 0.05, **p < 0.01 and ***p < 0.001 indicate a significant difference from vehicle control.
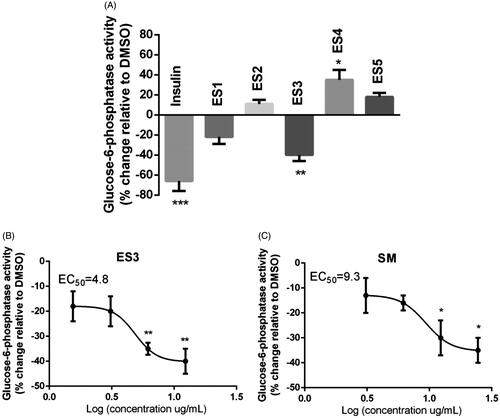
Figure 4. (A) Adipogenic activity of E. sativa extracts tested at their maximum non-toxic concentrations in 3T3-L1 adipocytes, as assessed by triglyceride content at the end of differentiation period. Two-day post-confluent preadipocytes were incubated with the plant extracts on day 0 of differentiation for 8 day. (B) and (C) are dose-response analysis of the adipogenic activities of ES3 and SM, respectively. Cells were incubated with several concentrations of ES3 (1.56, 3.12, 6.25 and 12.5 μg/mL) or SM (3.12, 6.25, 12.5 and 25 μg/mL). Data are represented as mean ± SEM and are expressed as % change in intracellular triglyceride content relative to the positive control rosiglitazone (10 μM), which was set at 100%. Assays were carried out in triplicate. **p < 0.01 and ***p < 0.001 indicate a significant difference from vehicle control. Rosi: rosiglitazone.
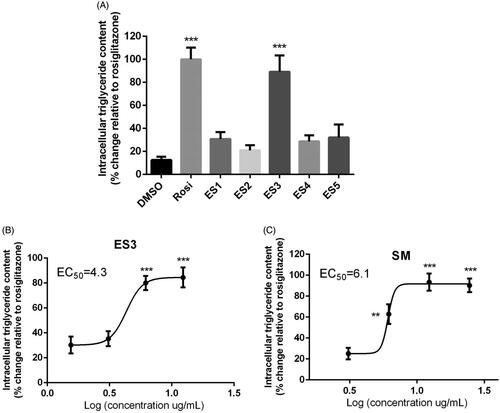
Table 3. GC/MS analysis of the SM of the n-hexane extract of E. sativa Mill. leaves.
Table 4. GC/MS analysis of the USM of the n-hexane extract of E. sativa Mill. leaves.