Figures & data
Figure 1. Effect of icariin on cell viability in OGD-treated PC12 cells. Model control cells were treated with 2 h OGD. The treated cells were incubated with icariin (10−7, 10−6 or 10−5 mol/L) or nimodipine (10 μmol/L) 1 h before OGD and 2 h throughout OGD. Normal control cells were incubated in a regular cell culture incubator under normoxic conditions. After these treatments, cell viability was analyzed using MTT assay. Mean ± SD for 10 samples. ##p < 0.01 vs normal control group. **p < 0.01 vs model control group.
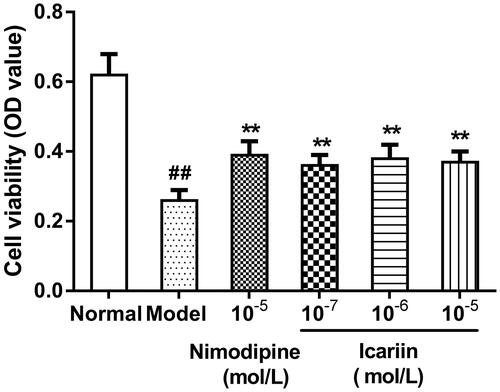
Figure 2. Effect of icariin on HIF-1α levels in OGD-treated PC12 cells. Model control cells were treated with 2 h OGD. The treated cells were incubated with icariin (10−7, 10−6 or 10−5 mol/L) or nimodipine (10 μmol/L) 1 h before OGD and 2 h throughout OGD. Normal control cells were incubated in a regular cell culture incubator under normoxic conditions. After these treatments, HIF-1α levels in cell supernatant fluid were analyzed using ELISA assay. Mean ± SD for six samples. ##p < 0.01 vs normal control group. **p < 0.01 vs model control group.
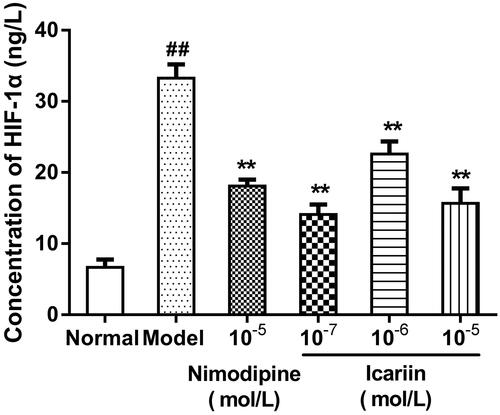
Figure 3. Effect of icariin on HSP-60 levels in OGD-treated PC12 cells. Model control cells were treated with 2 h OGD. The treated cells were incubated with icariin (10−7, 10−6 or 10−5 mol/L) or nimodipine (10 μmol/L) 1 h before OGD and 2 h throughout OGD. Normal control cells were incubated in a regular cell culture incubator under normoxic conditions. After these treatments, HSP60 levels in cell supernatant fluid were analyzed using ELISA assay. Mean ± SD for six samples. ##p < 0.01 vs normal control group. **p < 0.01 vs model control group.
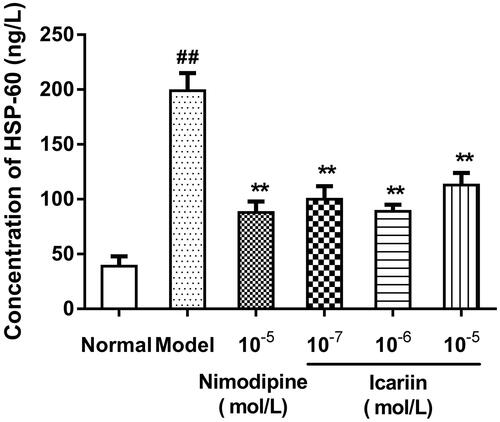
Figure 4. Effect of icariin on HSP-70 levels in OGD-treated PC12 cells. Model control cells were treated with 2 h OGD. The treated cells were incubated with icariin(10−7, 10−6 or 10−5 mol/L) or nimodipine (10 μmol/L) 1 h before OGD and 2 h throughout OGD. Normal control cells were incubated in a regular cell culture incubator under normoxic conditions. After these treatments, HSP70 levels in cell supernatant fluid were analyzed using ELISA assay. Mean ± SD for six samples. ##p < 0.01 vs normal control group. **p < 0.01 vs model control group.
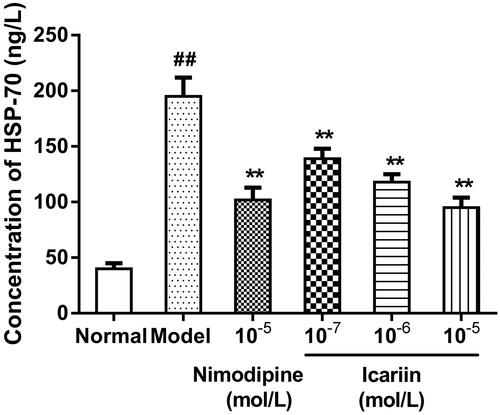
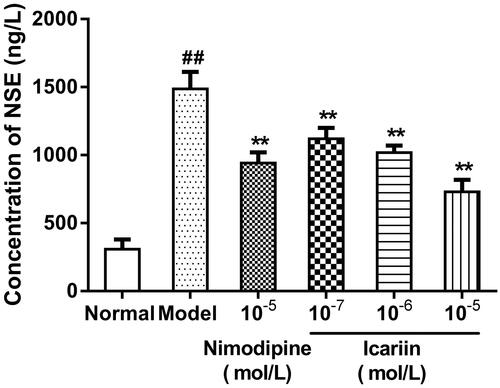
Figure 5. Effect of icariin on NSE levels in OGD-treated PC12 cells. Model control cells were treated with 2 h OGD. The treated cells were incubated with icariin(10−7, 10−6 or 10−5 mol/L) or nimodipine (10 μmol/L) 1 h before OGD and 2 h throughout OGD. Normal control cells were incubated in a regular cell culture incubator under normoxic conditions. After these treatments, NSE levels in cell supernatant fluid was analyzed using ELISA assay. Mean ± SD for six samples. ##p < 0.01 vs normal control group. **p < 0.01 vs model control group.