Figures & data
Table 1. Origins of AS from Gansu.
Figure 1. HPLC fingerprint graphics of AS. Analytical column: ODS-C18, 4.6 mm ×25 cm,5 μm; injected sample volume: 10 μL; mobile phase: 1.0% acetic acid in water (A) and acetonitrile (B) using a gradient program of 20–30% (B) in 0–10 min, 30–49% (B) in 1 0–20 min, 49% (B) in 2 0–40 min; 49–100% (B) in 40–50 min;100–20% (B) in 5 0–60 min; flow rate: 1 mL·min- 1; temperature: 25 °C; UV detection: 280 nm. (1) ferulic acid; (2) senkyunolide I; (3) senkyunolide H; (4) unkown compounds; (5) coniferyl ferulate; (6) senkyunolide A; (7) butylphthalide; (8) E-ligustilide; (9) Z-ligustilide; (10) Z-butylidenephthalide; (11) levistolide A.
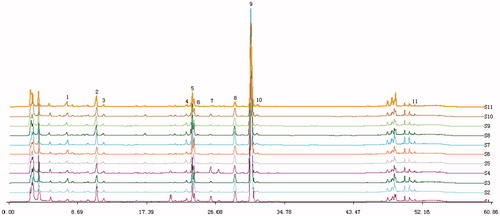
Table 2. The impact on peripheral blood of AS decoction.
Figure 2. Differential effect of AS treatment on BD as visualized by 2D PAGE. Liver were extracted and analyzed by 2D PAGE (first dimension, 18 cm, pH 4–7, nonlinear gradient of IPG strips; second dimension, 12.5% SDS-PAGE) and visualized by silver staining. (A) control; B BD; C ASM; D ASL;E ASH;.
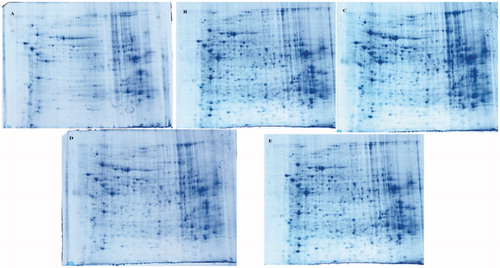
Figure 3. Protein expression profiles of mouse liver tissues of control, BD, ASL, ASM, ASH group. The protein expression profiles were examined using 2-DE system which were demonstrated by representative gel images. To ensure reproducible results for each protein sample, duplicate or triplicate electrophoreses were performed. Differentially expressed spots between control group and BD group were found by comparing the spot intensities using PD-Quest software. Differentially expressed spots were indicated in the images by arrows. There were11 differentially expressed spots that could be identified from the AS extract, respectively, compared with the DMSO control. The numbered protein spots were identified by MALDI-TOF/TOF mass spectrometry. The corresponding protein spot identities are shown in .
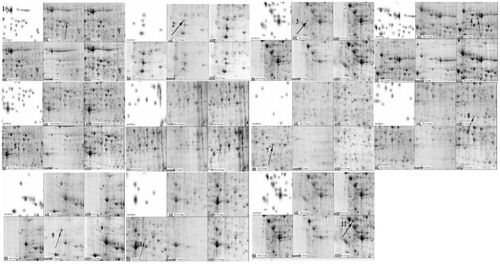
Table 3. AS influence on liver proteins of BD mice.
Figure 4. GC-MS TIC of the liver tissue homogenate (a) Control; (b) BD; (c) ASH; (d) ASM; (e) ASL.
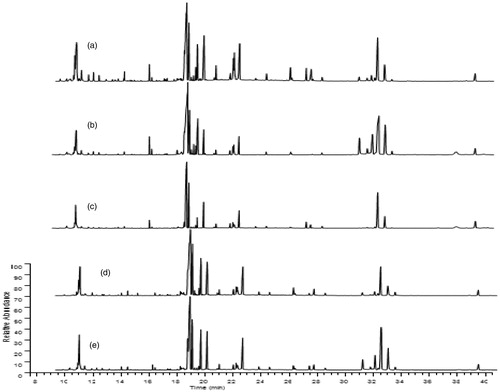
Figure 5. PCA score plots of liver tissue homogenate from the BD (1-8) and control (9-16) groups. Evident separated clustering of liver injury and the control groups are noted.
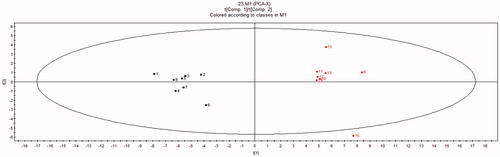
Figure 6. PLS-DA score plots of liver tissue homogenates Modelling Diagnostic: R2X = 0.311, R2Y = 0.930, Q = 0.78; 1–8, control; 9–16, BD; 17–24, ASH; 25–32, ASM; 33–40, ASL.
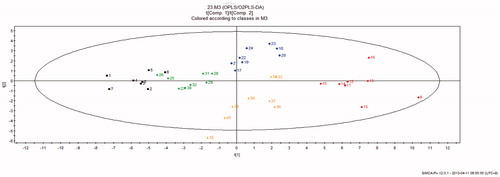
Table 4. Endogenous metabolites in the liver tissue homogenate.
Table 5. AS influence on liver metabolites of BD mice.
Figure 7. Summary of Pathway Analysis with MetPA; (a) Valine, leucine and isoleucine biosynthesis, (b) Glycine, serine and threonine metabolism, (c) Arachidonic acid metabolism, (d) Fructose and mannose metabolism.
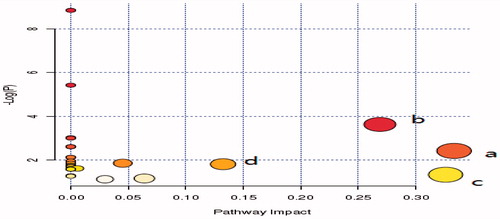
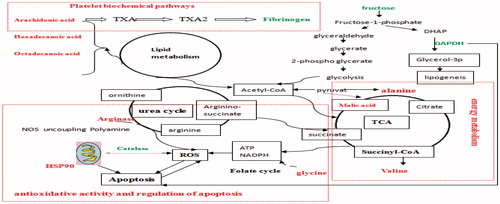
Figure 8. The summarized change at proteomic and metabonomic levels in BD mice liver. Metabolites and proteins in red and green represent an increasing and decreasing concentration in the APH and CTX that interfered, respectively.