Figures & data
Table 1. Effect of the treatment with ASc and NPASc in biochemical parameters in rats.
Figure 1. Effect of the treatment with ASc and NPASc on AOPP levels in serum (μM/L) and tissue (μmol/L/g of protein) of rats. Values are expressed as mean ± SEM (n = 6). Mean values with different letters differ (p < 0.05) by the Duncan test. DM: diabetic rats; CA: rats infected with C. albicans; CA + ASc: rats infected with C. albicans and treated with ASc; CA + NPASc: rats infected with C. albicans and treated with NPASc; DM + CA: diabetic rats infected with C. albicans; DM + CA + ASc: diabetic rats infected with C. albicans and treated with ASc; DM + CA + NPASc: diabetic rats infected with C. albicans and treated with NPASc.
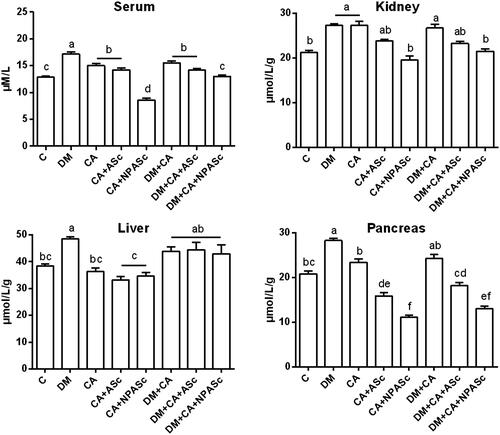
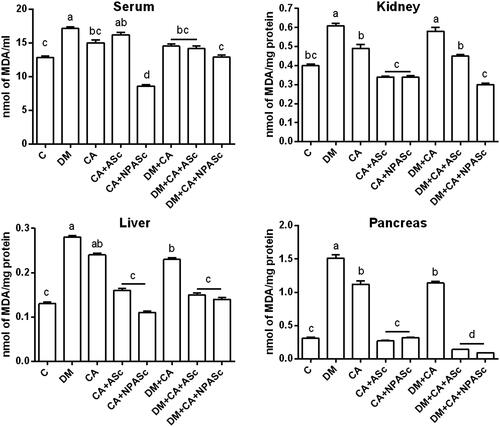
Figure 2. Effect of the treatment with ASc and NPASc on lipoperoxidation levels in serum (nmol of MDA/ml) and tissue (nmol of MDA/mg protein) of rats. Values are expressed as mean ± SEM (n = 6). Mean values with different letters differ (p < 0.05) by the Duncan test. DM: diabetic rats; CA: rats infected with C. albicans; CA + ASc: rats infected with C. albicans and treated with ASc; CA + NPASc: rats infected with C. albicans and treated with NPASc; DM + CA: diabetic rats infected with C. albicans; DM + CA + ASc: diabetic rats infected with C. albicans and treated with ASc; DM + CA + NPASc: diabetic rats infected with C. albicans and treated with NPASc.