
Figures & data
Table 1. The antioxidant properties and total phenolic contents of Sida rhombifolia.
Figure 1. DPPH radical scavenging activity of S. rhombifolia. Each data point represents the mean ± SD of three independent experiments.
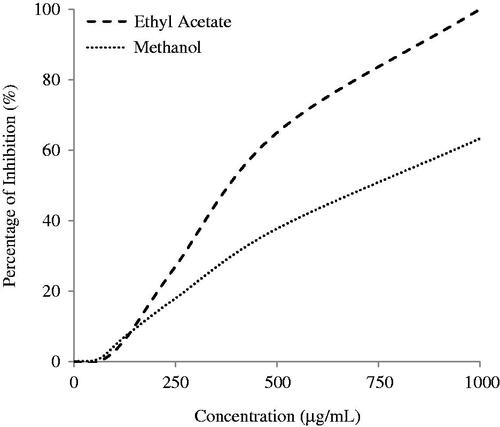
Figure 2. Ferrous ion chelating capability of S. rhombifolia. Each data point represents the mean ± SD of three independent experiments. Bars denote statistically significant differences at p < 0.05.
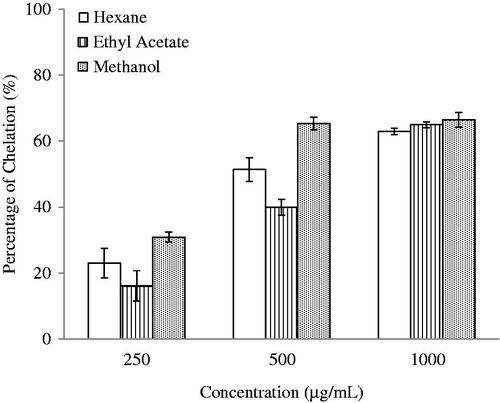
Figure 3. Ferric-reducing antioxidant power of S. rhombifolia. Each data point represents the mean ± SD of three independent experiments.
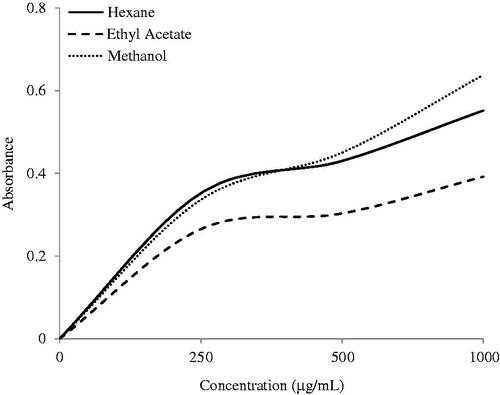
Figure 4. Anti-inflammatory activity of S. rhombifolia on NO Inhibition. Each data point represents the mean ± SD of three independent experiments. Bars denote statistically significant differences at p < 0.05.
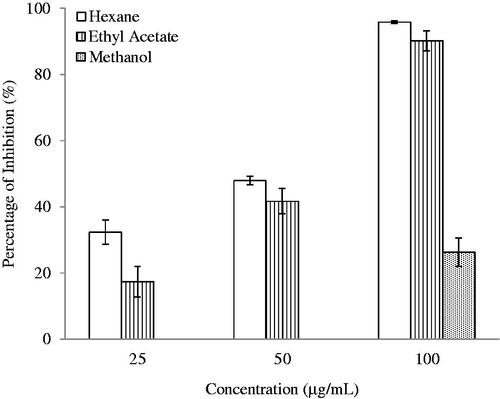
Table 2. Anti-inflammatory properties of Sida rhombifolia.
Figure 5. Anti-inflammatory effect of S. rhombifolia on protein denaturation. Each data point represents the mean ± SD of three independent experiments. Bars denote statistically significant differences at p < 0.05.
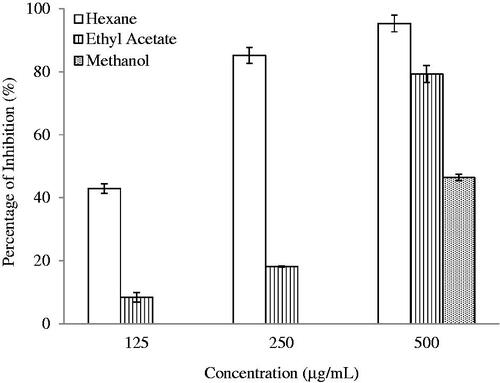
Figure 6. Anti-proliferative activity of S. rhombifolia at 100 μg/mL against cancer cells. Each data point represents the mean ± SD of three independent experiments. Bars denote statistically significant differences at p < 0.05.
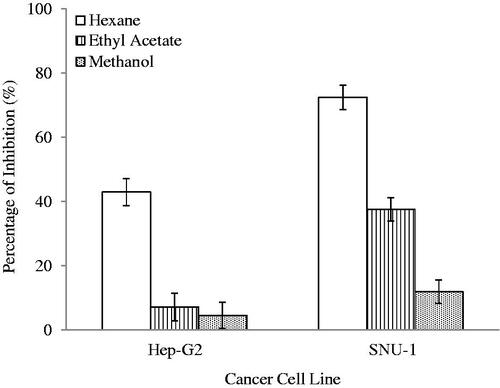
Figure 7. The lethality of S. rhombifolia. Each data point represents the mean ± SD of three independent experiments.
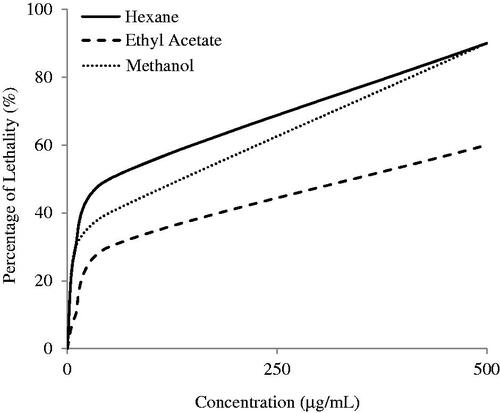
Figure 8. Anti-cholinesterase Activity of S. rhombifolia at 100 μg/mL. Each data point represents the mean ± SD of three independent experiments. Bars denote statistically significant differences at p < 0.05.
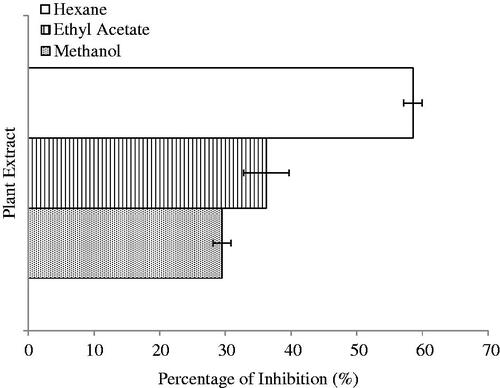
Figure 9. Gas chromatography spectrum of HEX extract of S. rhombifolia.
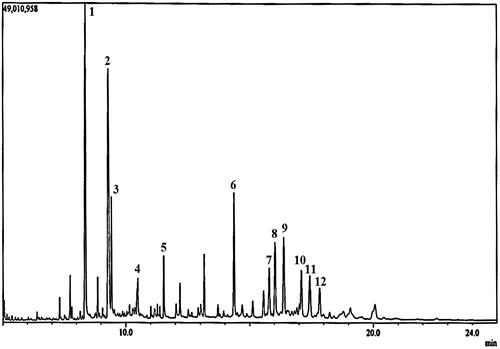
Table 3. Phytochemical constituents identified in the HEX extract of Sida rhombifolia by GC-MS analysis.