
Figures & data
Figure 1. Concentration-dependent inhibitory effect of (a) crude extract of N. ruderalis (Nr.Cr) and (b) verapamil, on spontaneously contracting isolated jejunum. Values are expressed as mean ± SEM, n = 4–5.
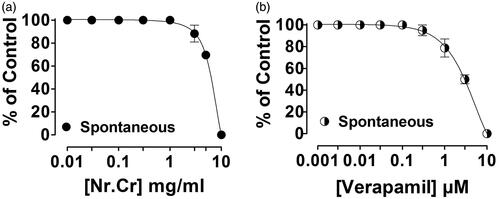
Figure 2. Concentration-dependent inhibitory effect of (a) crude extract of N. ruderalis (Nr.Cr) and (b) verapamil on high K+ (80 mM) and carbachol (1 μM) induced pre-contracted isolated jejunum. Values are expressed as mean ± SEM, n = 4.
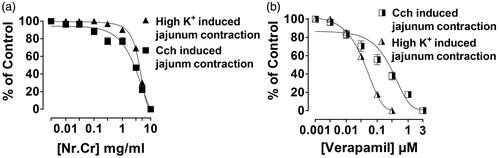
Figure 3. Concentration-dependent inhibitory effect of (a) crude extract of N. ruderalis (Nr.Cr) and (b) verapamil on high K+ (80 mM) and carbachol (1 μM) induced pre-contracted isolated trachea. Values are expressed as mean ± SEM, n = 5.
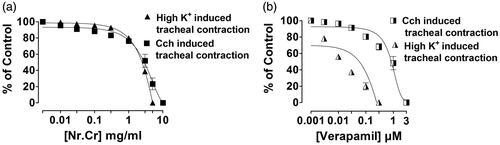
Figure 4. Concentration–response curves of Ca+2 (CRCs) in the absence and the presence of (a) crude extract of N. ruderalis (Nr.Cr) and (b) verapamil on isolated rabbit trachea. Values are expressed as mean ± SEM, n = 3, *p < 0.05, **p < 0.01 versus control, one-way ANOVA, followed by Dunnett’s test.
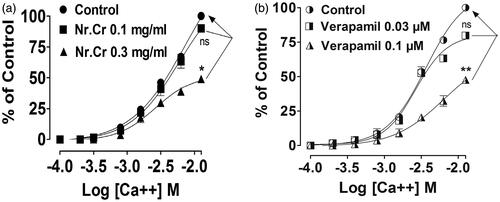
Figure 5. Counted number of wet and total faeces of each test group, exhibiting the results from left to right of negative control, 300 mg/kg, 500 mg/kg of crude extract of Nr.Cr, verapamil, and loperamide. Values are expressed as mean ± SEM, ##p < 0.01 versus wet faeces and **p < 0.01 versus total number of faeces of the diseased group, one-way ANOVA, followed by Dunnett’s test.
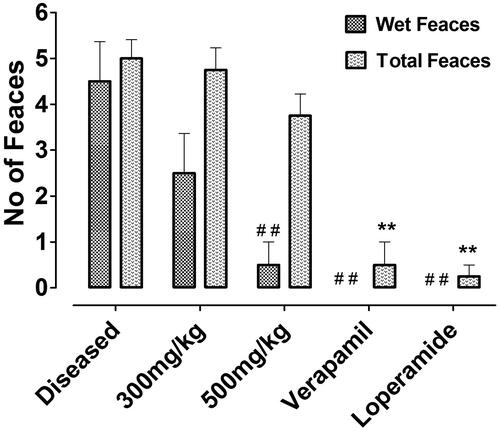
Table 1. Percentage protection of crude extract of N. ruderalis (Nr.Cr) against castor oil (10 ml/kg)-induced diarrhoea in mice (n = 5).