Figures & data
Figure 1. TLC densitometric chromatogram for standard linoleic acid (A) and CPEE (B).
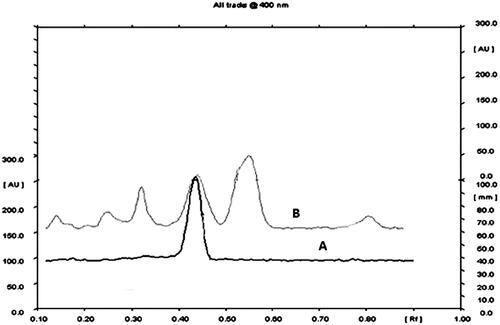
Figure 2. Effect of CPEE and its various fractions on the body weight of 3-NP treated rats. Results are expressed as mean (%) change in body weight ± SD (n = 8); ap < 0.05 vs control; bp < 0.05 vs 3-NP; cp < 0.05 vs CPEE 100 mg/kg; dp < 0.05 vs AF (9 mg/kg); ep < 0.05 vs AF (18 mg/kg); fp < 0.05 vs AF (36 mg/kg). Results are compared using one way analysis of variance followed by Tukey’s post hoc test. CPEE: ethanol extract of Celastrus paniculatus seeds; PF: petroleum ether fraction; EF: ethyl acetate fraction; BF: n-butanol fraction; AF: aqueous fraction.
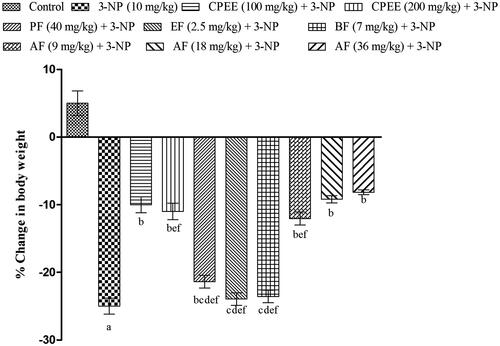
Figure 3. Effect of CPEE and its various fractions on the grip strength of 3-NP treated rats. Results are expressed as mean total time of fall ± SD (n = 8); ap < 0.05 vs control; bp < 0.05 vs 3-NP; cp < 0.05 vs CPEE 100 mg/kg; dp < 0.05 vs AF (9 mg/kg); ep < 0.05 vs AF (18 mg/kg); fp < 0.05 vs AF (36 mg/kg). Results are compared using two way analysis of variance followed by Bonferroni’s post hoc test. CPEE: ethanol extract of Celastrus paniculatus seeds; PF: petroleum ether fraction; EF: ethyl acetate fraction; BF: n-butanol fraction; AF: aqueous fraction.
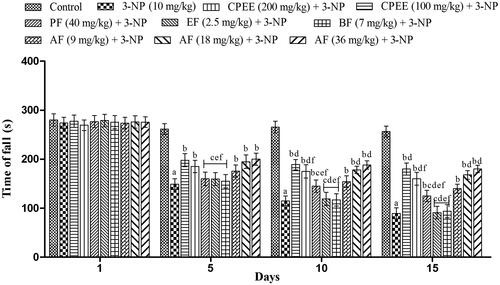
Figure 4. Effect of CPEE and its various fractions on locomotor activity of 3-NP treated rats. Results are expressed as mean total count ± SD (n = 8); ap < 0.05 vs control; bp < 0.05 vs 3-NP; cp < 0.05 vs CPEE 100 mg/kg; dp < 0.05 vs AF (9 mg/kg); ep < 0.05 vs AF (18 mg/kg); fp < 0.05 vs AF (36 mg/kg). Results are compared using two way analysis of variance followed by Bonferroni’s post hoc test. CPEE: ethanol extract of Celastrus paniculatus seeds; PF: petroleum ether fraction; EF: ethyl acetate fraction; BF: n-butanol fraction; AF: aqueous fraction.
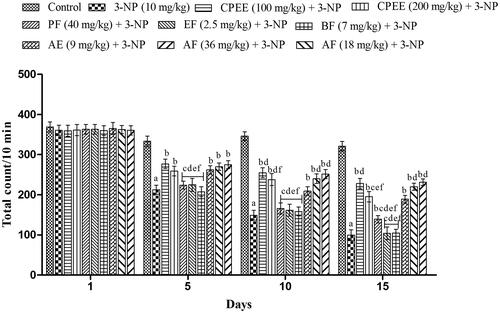
Figure 5. Effect of CPEE and its various fractions on gait functions of 3-NP treated rats. (A) Time taken to cross the narrow beam; (B) number of slips. Results are expressed as mean ± SD (n = 8); ap < 0.05 vs control; bp < 0.05 vs 3-NP; cp < 0.05 vs CPEE 100 mg/kg; dp < 0.05 vs AF (9 mg/kg); ep < 0.05 vs AF (18 mg/kg); fp < 0.05 vs AF (36 mg/kg). Results are compared using two way analysis of variance followed by Bonferroni’s post hoc test. CPEE: ethanol extract of Celastrus paniculatus seeds; PF: petroleum ether fraction; EF: ethyl acetate fraction; BF: n-butanol fraction; AF: aqueous fraction.
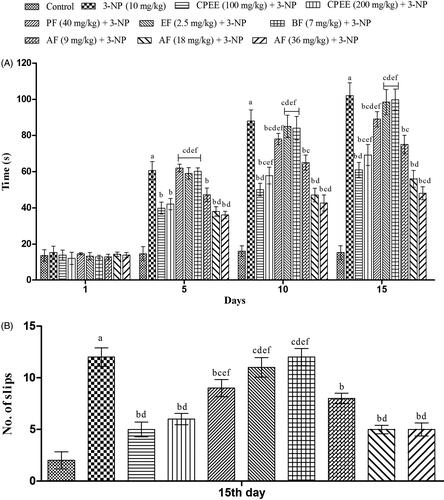
Figure 6. Effect of CPEE and its various fractions on memory functions of 3-NP treated rats on Morris water maze. (A) Time taken (s) by rats to reach platform (transfer latency); (B) time spent (s) in target quadrant. Results are expressed as mean ± SD (n = 8); ap < 0.05 vs control; bp < 0.05 vs 3-NP; cp < 0.05 vs CPEE 100 mg/kg; dp < 0.05 vs AF (9 mg/kg); ep < 0.05 vs AF (18 mg/kg); fp < 0.05 vs AF (36 mg/kg). Results are compared using two way analysis of variance followed by Bonferroni’s post hoc test. CPEE: ethanol extract of Celastrus paniculatus seeds; PF: petroleum ether fraction; EF: ethyl acetate fraction; BF: n-butanol fraction; AF: aqueous fraction.
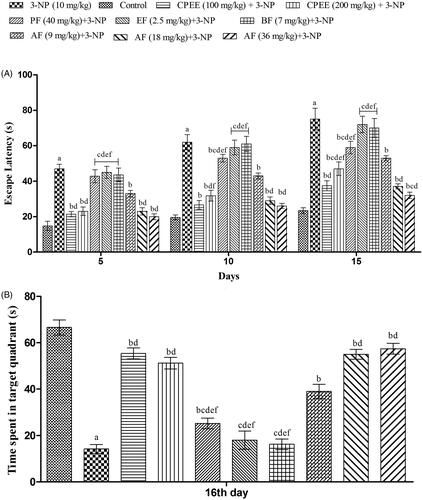
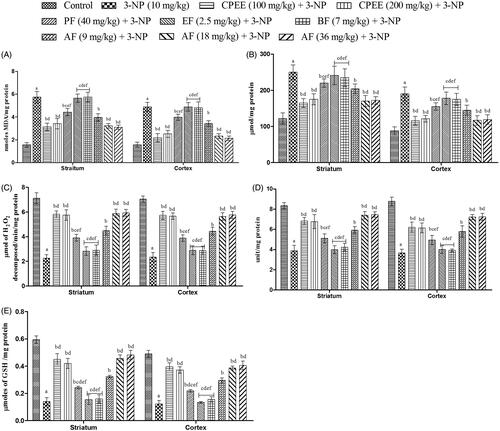
Figure 7. Effect of CPEE and its various fractions on oxidative parameters of 3-NP treated rats. (A) MDA levels; (B) nitrite levels; (C) catalase levels; (D) SOD levels; (E) reduced GSH levels. Results are expressed as mean ± SD (n = 8). ap < 0.05 vs control; bp < 0.05 vs 3-NP; cp < 0.05 vs CPEE 100 mg/kg; dp < 0.05 vs AF (9 mg/kg); ep < 0.05 vs AF (18 mg/kg); fp < 0.05 vs AF (36 mg/kg). Results are compared using one way analysis of variance followed by Tukey’s post hoc test. CPEE: Ethanol extract of Celastrus paniculatus seeds; PF: petroleum ether fraction; EF: ethyl acetate fraction; BF: n-butanol fraction; AF: aqueous fraction.