
Figures & data
Figure 1. Estimation of presence of several phytoconstituents in SVE. (A) Thin layer chromatographic (TLC) separation of phytoconstituents in SVE. Presence of spot 1, 2, 3, 4 and 5 over TLC plate indicates presence of five different types of compounds in the extract. (B) Determined Rf value of each compound present in spot 1, 2, 3, 4 and 5 in TLC plate. Rf values were determined from the distance of spot 1, 2, 3, 4 and 5 with respect to the distance of solvent front of polar mobile phase from the origin point. Each value is the average of triplicate assay where presented data are mean ± SD. (C) UV–vis spectroscopic analysis of the SVE. Obtained graph shows several peaks in UV region which represents the presence of active phytochemicals in the extract. (D) IR spectroscopic analysis of SVE where obtained graph shows several peaks having different wave number. These represent several functional groups that are present in the SVE.
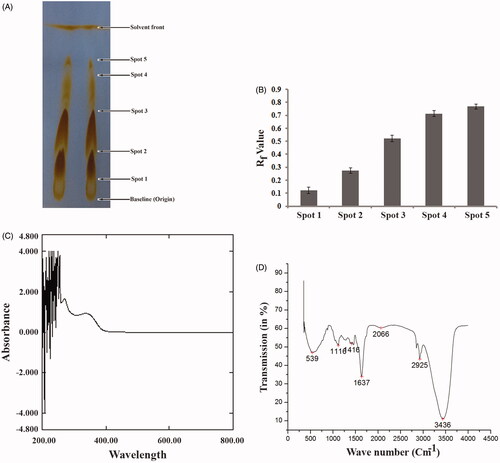
Table 1. Qualitative phytochemical screening of SVE through several biochemical assays.
Figure 2. Antileishmanial activity of SVE against Leishmania donovani promastigotes were determined by MTT assay. Viable cell numbers were plotted against concentration of SVE and IC50 dose of 17.5 μg/mL was determined where maximum activity of SVE occurs at 10 μg/mL (IC70). Each value is the average of triplicate assay where presented data are mean ± SD.
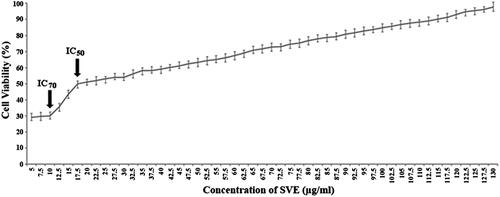
Figure 3. Antileishmanial activity of SVE against Leishmania donovani promastigotes was visualized through observation under fluorescence microscope after staining with acridine orange. Result shows that Leishmania donovani promastigote numbers were significantly reduced after treatment with IC50 dose of SVE (B), and IC50 dose of standard drug amphotericin B (C) with respect to untreated control (A). Pictures were obtained from 20 different fields of the same treatment and best pictures were presented here.
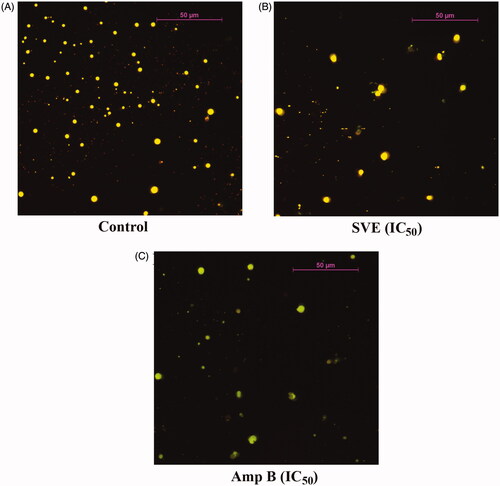
Figure 4. Determination of ROS, superoxides, lipid peroxidation level and genomic instability of promastigotes. Measurement of ROS production after treatment of AG83 promastigotes with IC50 dose of SVE (A). Determination of SVE (IC50 dose) treated superoxide generation after treatment of AG83 promastigotes (B). The level of fluorescent products of lipid peroxidation was measured after treatment of AG83 promastigotes with IC50 dose of SVE (C). Each value is the average of triplicate assay where presented data are mean ± SD. Statistical analysis was done using one way ANOVA, *p value <0.01 and **p value <0.001 (n = 3). Fragmentation of genomic DNA in the presence of IC50 dose of SVE compared to untreated control. Genomic DNA was isolated from AG83 promastigotes after 2 h treatment of SVE (lane 2), IC50 dose of standard drug AmpB (lane 3) compared with untreated control (lane 1) and DNA ladder (lane 4) (D).
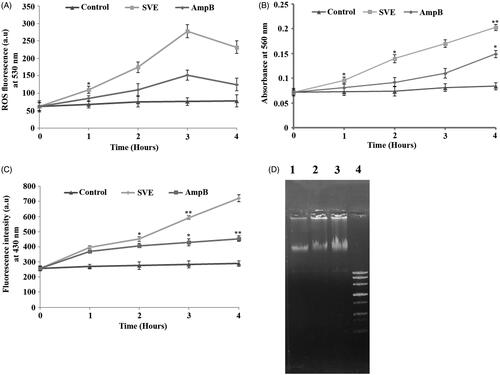
Figure 5. Determination of particle size of phytoconstituents present in SVE by atomic force microscope. Gradient concentrations of SVE were spread as film, observed under atomic force microscope and presented the image of observed particle with particle size distribution graph. Image and particle size of compounds at 10 μg/mL (A(i) and (ii)), 17.5 μg/mL (B(i) and (ii)) and 130 μg/mL (C(i) and (ii)) explain that with increase in concentration of SVE particle size of compounds increases.
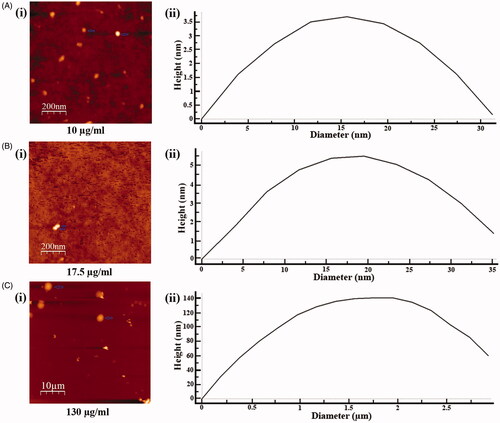
Figure 6. Percentage cytotoxicity of 17.5 μg/mL of SVE and 0.16 μg/mL of amphotericin B against RAW 264.7 macrophages, murine peritoneal macrophages and murine RBC was determined. Each value is the average of triplicate assay where presented data are mean ± SD.
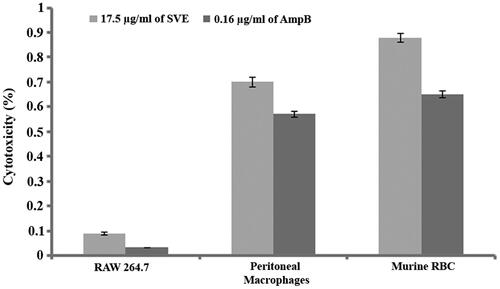
Table 2. Analysis of liver function and other serum parameters from mouse serum by biochemical colour test.