Figures & data
Table 1. Description of the experimental groups.
Table 2. Relative cell viability of OHE, with or without UVB irradiation (% of normal control).
Figure 1. mRNA expression of HAS1, HAS2 and HAS3 in UVB-irradiated HaCaT cells was affected by OHE treatment in a dose-dependent manner. (A) HAS1 mRNA levels, (B) HAS2 mRNA levels, (C) HAS3 mRNA levels. All results expressed a one-fold change compared to the UV-treated control group (UV-Con). HAS: hyaluronic acid synthase; OHE: O. humifusa extract; Normal: untreated HaCaT cells; UVBC: UVB-irradiated HaCaT cells (without OHE treatment). The values are the mean ± standard deviation (SD) (n = 3). Different letters indicate significant differences (p < 0.05) among the treatments as indicated by Duncan’s multiple range test.
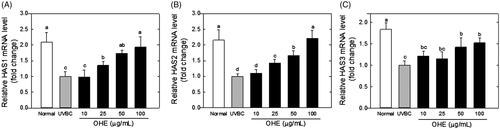
Figure 2. mRNA expression of HYAL in UVB-irradiated HaCaT cells was affected by OHE treatment in a dose-dependent manner. All results expressed a onefold change compared to the UV-Con. HYAL: hyaluronidase; OHE: O. humifusa extract; Normal: untreated HaCaT cells; UVBC: UVB-irradiated HaCaT cells (without OHE treatment). The values are the mean ± standard deviation (SD) (n = 3). Different letters indicate significant differences (p < 0.05) among the treatments as revealed by Duncan’s multiple range test.
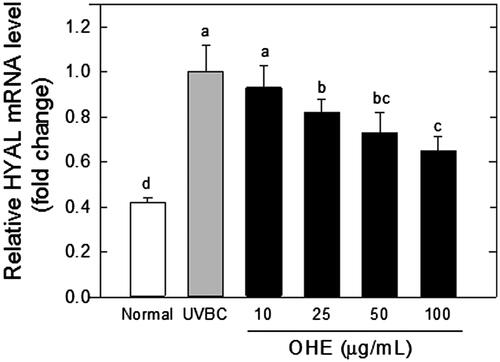
Figure 3. Epidermal thickness, CD44 and HABP expression in the skin of UVB-irradiated hairless mice treated with OHE. (A) H&E staining (epidermal thickness), (B) CD44 distribution and expression, (C) HABP distribution and expression, Normal: drinking water without OHE, no UVB irradiation; UVBC: drinking water without OHE plus UVB irradiation; UVB-ET: topical application of vehicle (15% eucalyptol); OL: 0.1% OHE in drinking water plus UVB irradiation; OH: 0.5% OHE in drinking water plus UVB irradiation; TL: topical application of OHE at 0.2 mg/cm2 plus UVB irradiation; TH: topical application of OHE at 0.4 mg/cm2 plus UVB irradiation. The values are the mean ± standard error of the mean (SEM) (n = 6). Different letters indicate significant differences (p < 0.05) among the groups as indicated by Duncan’s multiple range test.
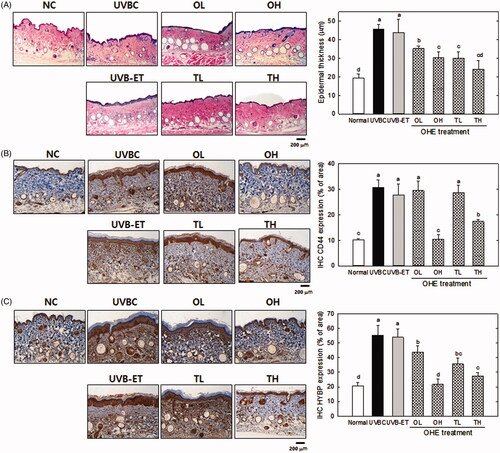
Figure 4. Hyaluronic acid content, and mRNA levels of HAS and HYAL in the skin of UVB-irradiated hairless mice treated with OHE. (A) HA content, (B) HAS mRNA expression and expression, (C) HYAL mRNA expression, Normal: drinking water without OHE, no UVB irradiation; UVBC: drinking water without OHE plus UVB irradiation; UVB-ET: topical application of vehicle (15% eucalyptol); OL: 0.1% OHE in drinking water plus UVB irradiation; OH: 0.5% OHE in drinking water plus UVB irradiation; TL: topical application of OHE at 0.2 mg/cm2 plus UVB irradiation; TH: topical application of OHE at 0.4 mg/cm2 plus UVB irradiation. The values are the mean ± standard error of the mean (SEM) (n = 6). Different letters indicate significant differences (p < 0.05) among the groups as indicated by Duncan’s multiple range test.
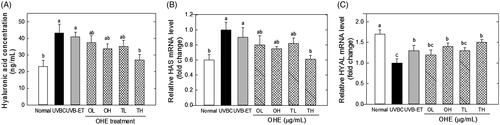
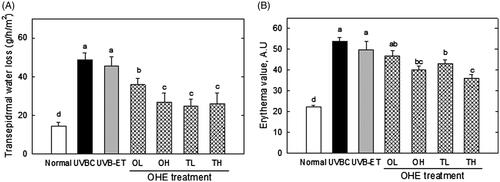
Figure 5. Transepidermal water loss and erythema value in the skin of UVB-irradiated hairless mice treated with OHE. (A) Transepidermal water loss in the dorsal mouse skin was examined using the Tewameter TM 300. (B) The erythema level was determined using a MexameterMX18. Normal: drinking water without OHE, no UVB irradiation; UVBC: drinking water without OHE plus UVB irradiation; UVB-ET: topical application of vehicle (15% eucalyptol); OL: 0.1% OHE in drinking water plus UVB irradiation; OH: 0.5% OHE in drinking water plus UVB irradiation; TL: topical application of OHE at 0.2 mg/cm2 plus UVB irradiation; TH: topical application of OHE at 0.4 mg/cm2 plus UVB irradiation. The values are the mean ± standard error of the mean (SEM) (n = 6). Different letters indicate significant differences (p < 0.05) among the groups as indicated by Duncan’s multiple range test.