
Figures & data
Figure 1. Structures of compounds 1–4 isolated from A. melegueta.
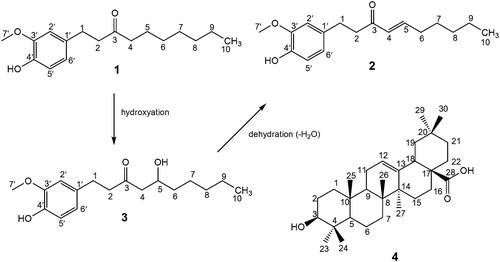
Table 1. 1H and 13C NMR data of compounds 1–4 isolated from A. melegueta (more details in the supplementary data file).
Figure 2. α-Amylase (A) and α-glucosidase (B) inhibitions (%) of compounds isolated from A. melegueta fruit. Data are presented as mean ± SD of triplicate determinations. a–e Values with different letters presented for a given concentration for each extract are significantly different from each other.
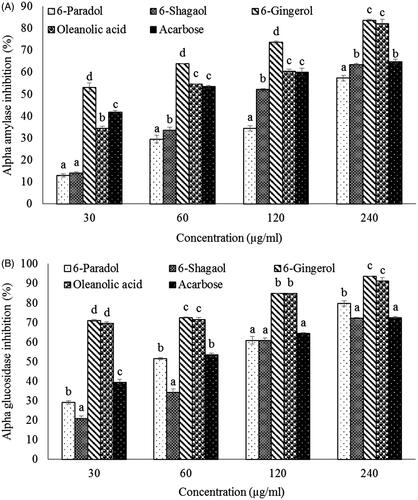
Table 2. IC50 values of bioactive compounds isolated from the A. melegueta fruit in antidiabetic models.
Figure 3. Lineweaver-Burke plots for α-amylase (A) and α-glucosidase (B) in the absence and presence of the inhibitors (bioactive compounds).
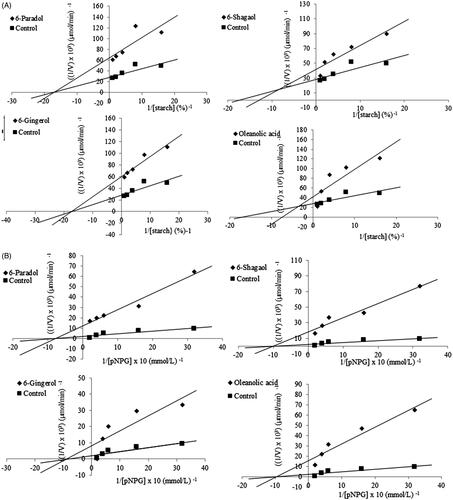
Table 3. Kinetic analysis of α-amylase and α-glucosidase inhibition by compounds isolated from the fruit of A. melegueta in antidiabetic models.