Figures & data
Figure 1. Flow chart of present study.
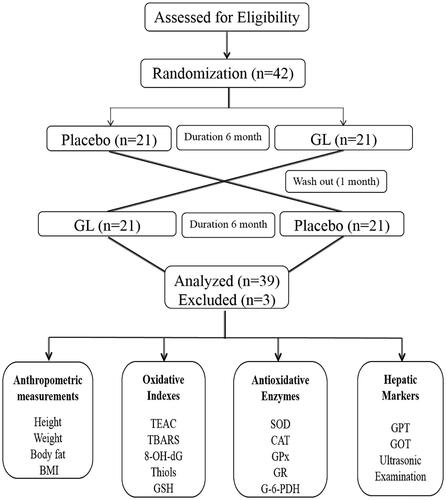
Table 1. The anthropometric parameters in GL and placebo-treated healthy subjects.
Table 2. Various plasma oxidative indexes in GL and placebo-treated healthy subjects.
Table 3. Erythrocyte antioxidative enzymes in GL and placebo-treated healthy subjects.
Table 4. The hepatic marker enzymes in plasma of GL and placebo-treated healthy subjects.
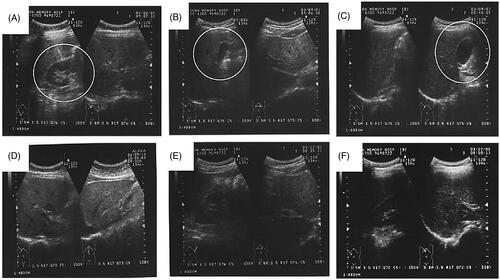
Figure 2. The abdominal ultrasonic image of GL-treated healthy subjects. Image A, B and C represents subject no. 10, 19 at baseline with mild fatty liver and subject no. 36 at baseline with gall bladder polyp (indicated with a circle). Image D, E and F represents subject no. 10, 19 and 36 after 6 months of GL treatment display normal hepatic structure without any signs of fatty liver or gallbladder polyp.