
Figures & data
Figure 1. Total phenolic content in various leaf extracts of A. odoratissima. The y-axis was cut up from 30 to 100 for better understanding.
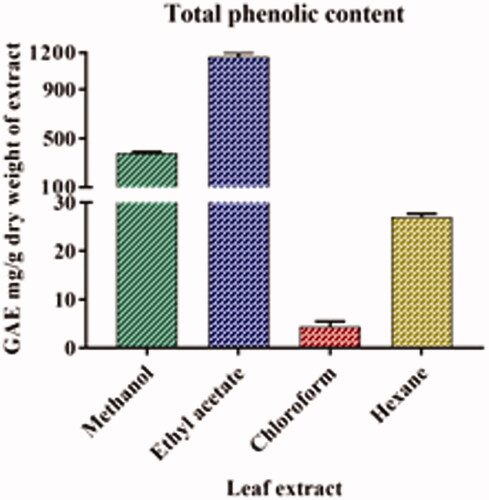
Table 1. Total phenolic content and total flavonoid content of various leaf extracts of Albizia odoratissima.
Figure 2. Total flavonoid content in various leaf extracts of A. odoratissima.
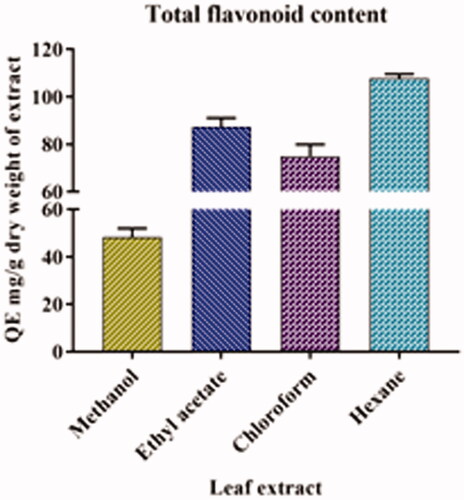
Figure 3. DPPH antioxidant activity of leaf extracts of Albizia odoratissima. The y-axis was cut up from 20 to 100 for better understanding.
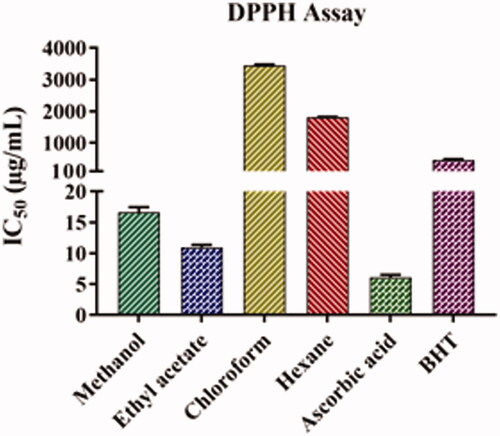
Table 2. Free radical scavenging activity of different leaf extracts of Albizia odoratissima.
Figure 4. ABTS antioxidant activity of leaf extracts of Albizia odoratissima. The y-axis was cut up from 10 to 20 for better understanding.
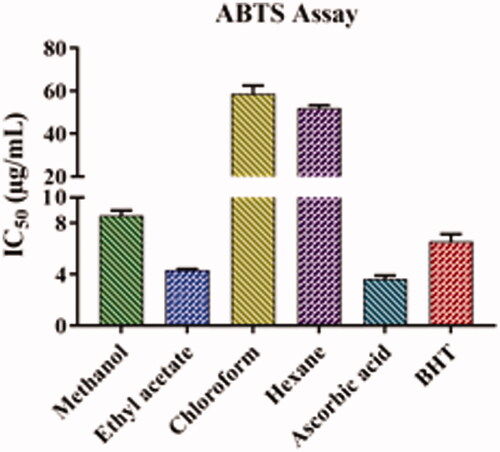
Figure 5. Hydrogen peroxide activity of leaf extracts of Albizia odoratissima.
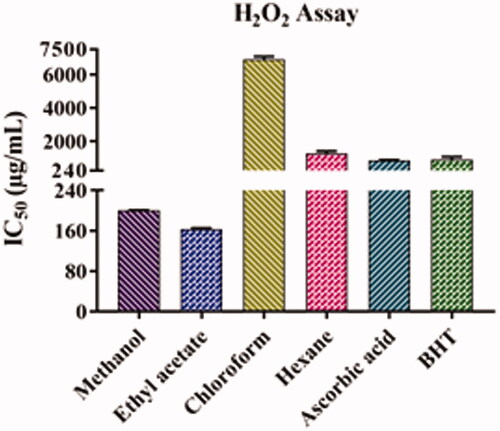
Figure 6. Ferric reducing antioxidant power activity of leaf extracts of Albizia odoratissima. The y-axis was cut up from 300 to 1000 for better understanding.
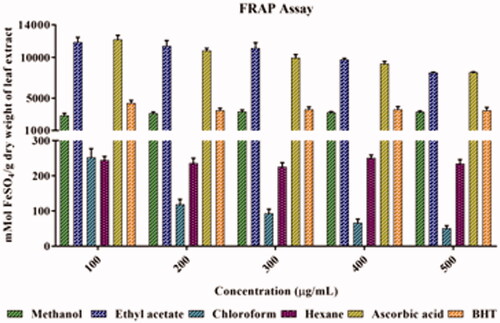
Table 3. Correlation matrix of total phenolic content, total flavonoid content and antioxidant activity measured by all the four in vitro assays.
Table 4. MIC and MBC of different leaf extracts of Albizia odoratissima against the tested pathogenic species.