
Figures & data
Figure 1. (A) Effect of the J. isabellei dichloromethane fraction (DFJi) 50, 100 and 200 mg/kg on paw elevation time (PET) after oral administration. (B) Effect of oral administration of the J. isabellei dichloromethane fraction (200 mg/kg), indomethacin (IND, 5 mg/kg), colchicine (COL, 30 mg/kg) and dexamethasone (DEX, 10 mg/kg) on paw elevation time (PET). The animals were treated 2 h after the intra-articular carrageenan injection (300 μg/knee). The negative control group received only the vehicle (DMSO:PEG 400:PBS 5:47.5:47.5). *p < 0.05; **p < 0.01 and ***p < 0.001 represent a significant difference compared with the negative control group. The statistical analysis was performed using one-way ANOVA followed by Dunnett’s post hoc test.
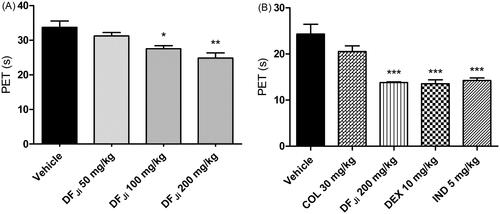
Figure 2. Effect of intravenous administration of the J. isabellei dichloromethane fraction (10, 25, and 50 mg/kg) and dexamethasone (DEX, 1 mg/kg) on paw elevation time (PET). The animals were treated 2 h after the intra-articular carrageenan injection (300 μg/knee). The negative control group received the vehicle (DMSO:polysorbate 80:saline solution 5:4:91). ***p < 0.001 represents a significant difference compared with the negative control group. The statistical analysis was performed using one-way ANOVA followed by Dunnett’s post hoc test.
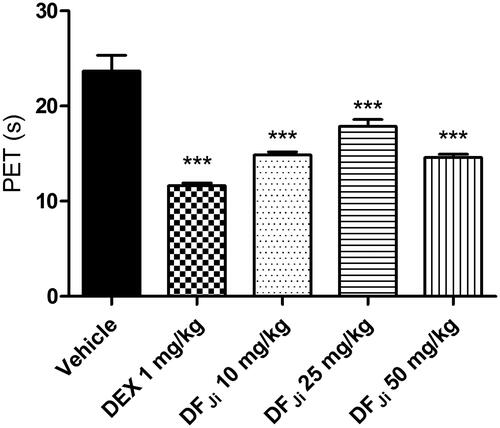
Figure 3. Effect of oral administration of the J. isabellei dichloromethane fraction (DFJi) on the rat paw edema. (A) Articular diameter (AD) of animals receiving different doses of the DFJi. (B) Articular diameter of animals receiving DFJi (200 mg/kg) and the positive controls indomethacin (IND, 5 mg/kg), colchicine (COL, 30 mg/kg), and dexamethasone (DEX, 10 mg/kg). The animals were treated 2 h after the intra-articular carrageenan injection (300 μg/knee). The negative control group received the vehicle (DMSO:PEG 400:PBS 5:47.5:47.5). *p < 0.05, **p < 0.01 and ***p < 0.001 represent a significant difference compared with the negative control group on the day of the experiment. The statistical analysis was performed using one-way ANOVA followed by Dunnett’s post hoc test.
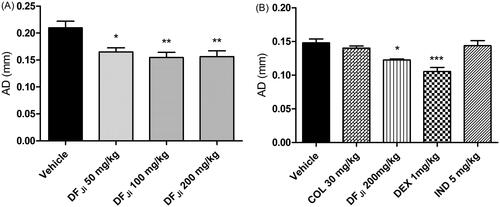
Figure 4. Effect of intravenous administration of the J. isabellei dichloromethane fraction (DFJi) and dexamethasone (DEX, 1 mg/kg) on the rat paw edema. The animals were treated 2 h after the intra-articular carrageenan injection (300 μg/knee). The negative control group received the vehicle (DMSO:polysorbate 80:saline solution 5:4:91). **p < 0.01 represents a significant difference compared with the negative control group. The statistical analysis was performed using one-way ANOVA followed by Dunnett’s post hoc test.
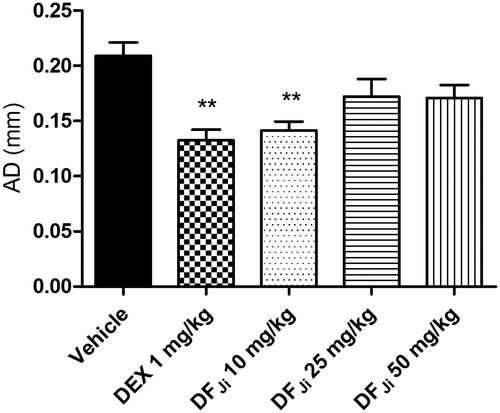
Figure 5. Structure of acetyl aleuritolic acid (1) and jatrophone (2) isolated from the DFJi.
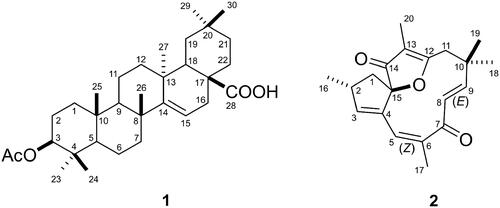
Figure 6. UFLC-DAD chromatograms obtained for the DFJi. (A) Detection at 200 nm, indicating the acetyl aleuritolic acid, (b) detection at 280 nm, enlarged, indicating the diterpene jatrophone, (c) detection at 280 nm displaying the jatrophone compound with a good resolution.
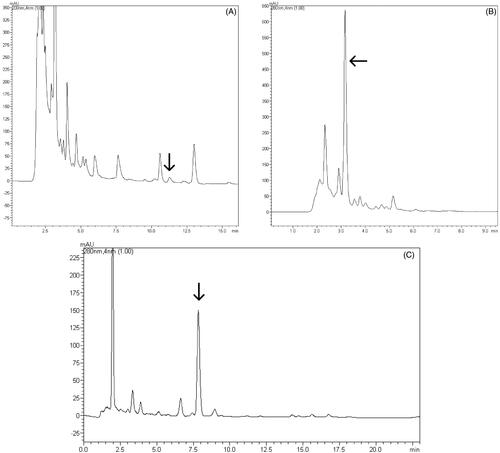
Table 1. Recovery values (%) obtained for the evaluation of the accuracy of the method.