Figures & data
Figure 1. Chemical structures of compounds 1–7 from P. trimera.
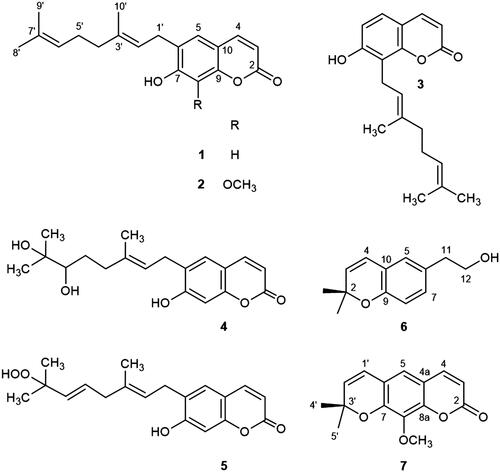
Figure 2. Effects of compounds 1–4, and 7 on nitrite production in LPS-stimulated BV2 microglia (A−E). Cells were pretreated for 3 h with the indicated concentrations of the compounds, then stimulated for 18 h with LPS (1 μg/mL). The concentrations of nitrite were determined using a Griess reaction. Data represent the mean ± S.D. of three experiments. #p < 0.05, as compared with the control group; *p < 0.05, as compared with the group treated with LPS only. Butein was used as the positive control.
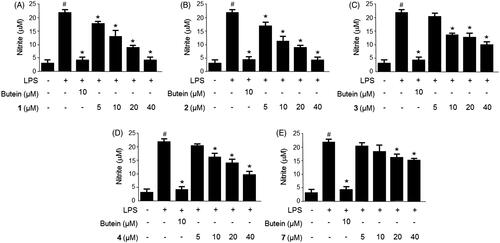
Figure 3. Effects of compounds 1–4, and 7 on PGE2 production in LPS-stimulated BV2 microglia (A−E). Cells were pretreated for 3 h with the indicated concentrations of the compounds and then stimulated for 18 h with LPS (1 μg/mL). The concentrations of PGE2 were determined using a PGE2 ELISA kit. Data represent the mean ± S.D. of three experiments. #p < 0.05, as compared with the control group; *p < 0.05, as compared with the group treated with LPS only. Butein was used as the positive control.
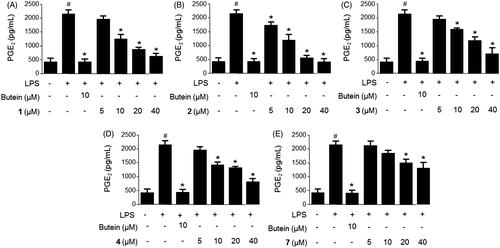
Table 1. Inhibitory effects of compounds 1–4, 6, and 7 on NO and PGE2 production.
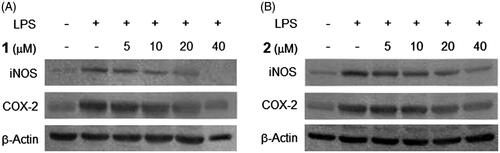
Figure 4. Effects of compounds 1 and 2 on iNOS and COX-2 protein expression in LPS-stimulated BV2 microglia. Cells were pretreated for 3 h with indicated concentrations of compounds 1 and 2, then stimulated for 24 h with LPS (1 μg/mL). Western blot analyses (A and B) were performed as described in ‘Materials and methods’ section.