
Figures & data
Figure 1. UPLC-MS/MS chromatograms, blank plasma spiked with midazolam, tolbutamide, metroprolol, bupropion, phenacetin and diazepam (IS).
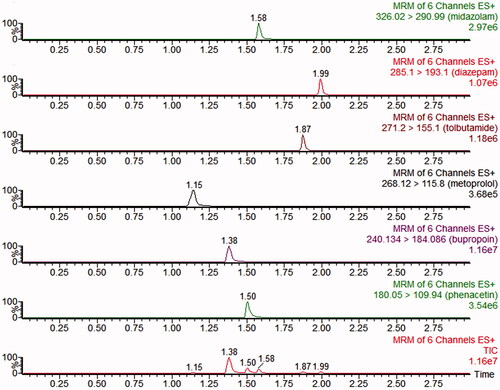
Figure 2. The pharmacokinetic profiles of bupropion, metroprolol, phenacetin, midazolam, tolbutamide in control group and codeine group (low, medium, high) rats (n = 8).
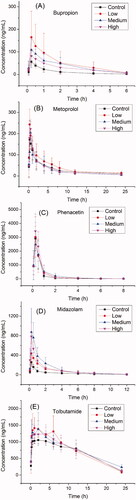
Table 1. Pharmacokinetic parameters of probe drugs from control group and codeine group rats (mean ± SD, n = 8).
Table 2. Biochemical results in rat serum after intragastric administration of codeine in the fourteenth day (mean ± SD, n = 8).