Figures & data
Table 1. The origin and respective voucher number of Dipsaci Radix.
Table 2. Linear relation between peak area and concentration.
Table 3. Precision of analytical results (n = 6).
Table 4. Repeatability and stability of analytical results (n = 6).
Table 5. Recoveries of marker compounds through standard addition (n = 6).
Figure 1. HPLC chromatogram of standard mixture (A), crude drug (B) and sweated sample (C): (1) LA; (2) CA; (3) CaA; (4) LN; (5) IB; (6) IA; (7) IC and (8) AVI.
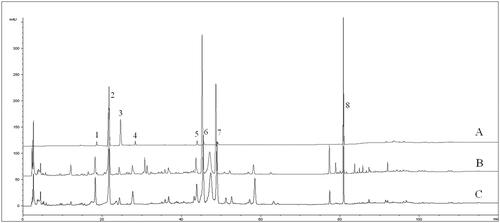
Figure 2. ESI-MS spectra of eight compounds.
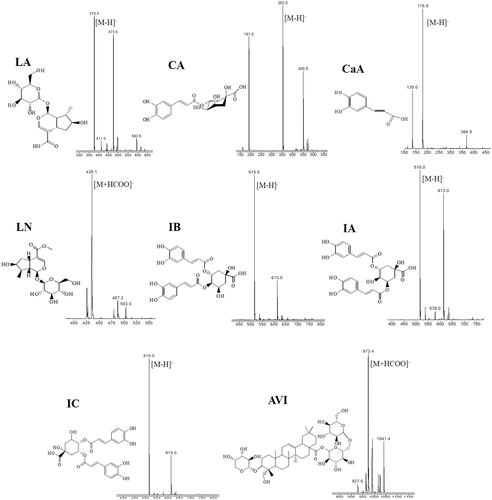
Table 6. Contents of eight components in Dipsaci Radix (% ± SD, n = 3).
Figure 3. Principal component analysis (PCA) of Dipsaci Radix.
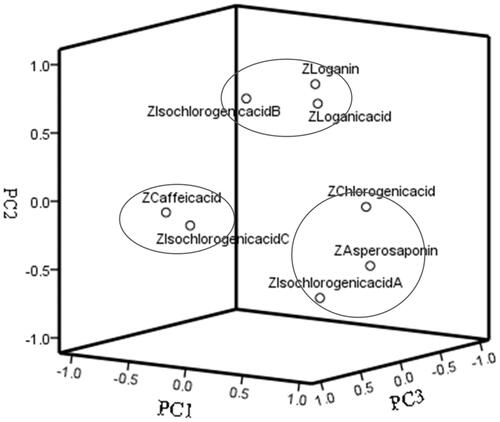
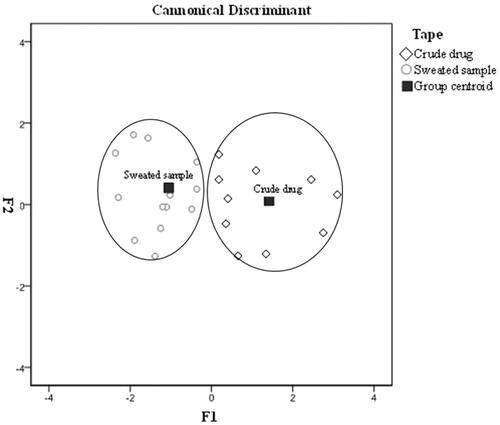
Figure 4. Discriminant analysis (DA) of the crude and sweated Dipsaci Radix.