Figures & data
Table 1. Effects of d-penicillamine and lasiodiplodan on behavioral parameters.
Figure 1. Effects of D-penicillamine and lasiodiplodan on TBARS levels. Data are expressed as mean ± S.E.M. *Statistical difference between the D-Pen group and the other groups (p < 0.05); &Statistical difference between the Las + D-Pen group and Ct (p < 0.05) - (one-way ANOVA with post-hoc Bonferroni’s Multiple Comparison test, n = 6 animals/group).
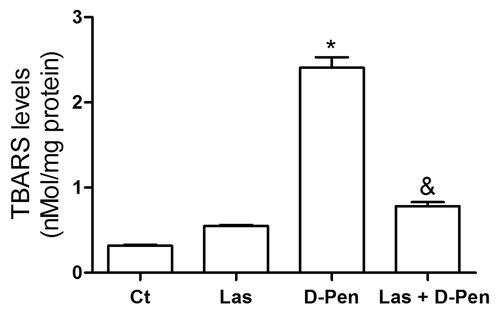
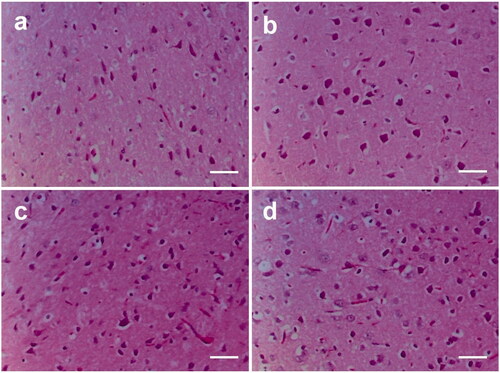
Figure 2. Effects of D-penicillamine and lasiodiplodan on cerebral cortex histology of rats (100x). (a) cerebral cortex from the Ct group; (b) cerebral cortex from the Las group; (c) cerebral cortex from the D-Pen group; (d) cerebral cortex from Las + D-Pen group. Scale bar 25 μm.