Figures & data
Table 1. Effect of CEL and its combination with FA on the LDH and CK-MB levels.
Table 2. Effect of CEL and its combination with FA on the Tn-T and TNF-α levels.
Table 3. Effect of CEL and its combination with FA on the cardiac TBARS and GSH levels.
Figure 1. Effect of CEL and its combination with FA on SBP. *p < 0.05 CEL + FA (3rd and 4th weeks) vs. Baseline, ***p < 0.001 CEL (3rd and 4th weeks) vs. Baseline; DOX (3rd week) vs. Baseline; and CEL + DOX (3rd week) vs. Baseline. †p < 0.05 CEL + FA (3rd week) vs. CEL, CEL + DOX (4th week) vs. DOX; ††p < 0.01 CEL (2nd week) vs. Control, †††p < 0.001 CEL (3rd and 4th weeks) vs. Control; CEL + FA (4th week) vs. CEL; DOX (3rd week) vs. Control; CEL + DOX (3rd week) vs. DOX; and CEL + FA + DOX (3rd and 4th weeks) vs. CEL + DOX. DOX: Doxorubicin; CEL: Celecoxib; FA: Folic acid; SBP: systolic blood pressure.
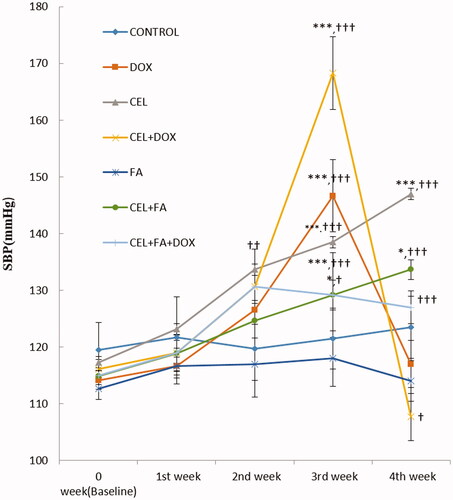
Figure 2. Effect of CEL and its combination with FA on heart rate. **p < 0.01 CEL (2nd week) vs. Baseline, ***p < 0.001 CEL (3rd and 4th weeks) vs. Baseline; CEL + FA (4th week) vs. Baseline; DOX (3rd week) vs. baseline; DOX (3rd vs. 4th week); CEL + DOX (3rd week) vs. Baseline; and CEL + DOX (3rd vs. 4th week). ††p < 0.01 CEL + DOX (3rd week) vs. DOX, †††p < 0.001 CEL (4th week) vs. Control; CEL + FA (4th week) vs. CEL; DOX (3rd and 4th weeks) vs. Control; and CEL + FA + DOX (3rd and 4th weeks) vs. CEL + DOX. DOX: Doxorubicin; CEL: Celecoxib; FA: Folic acid; BPM: Beats per min.
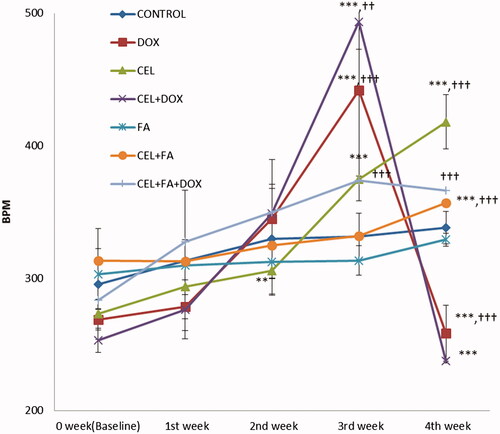
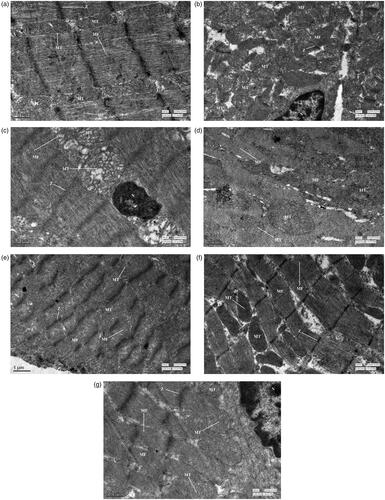
Figure 3. Transmission electron microscopy of cardiomyocytes. (a) Normal control group showing well-defined Z-bands (Z), myofibrils (MF) arranged in regular rows and mitochondria (MT). (b) DOX-treated group showing disarray of the myofibrillar arrangement, swollen mitochondria, and a pyknotic nucleus (N) with chromatin margination. (c) CEL-treated group showing loss of myofibrils, mild mitochondrial swelling, and condensed chromatin in the nucleus. (d) CEL + DOX treated group showing severe disruption revealing loss of myofibrils and mitochondrial swelling. (e) FA-treated group showing well-defined Z-Bands, myofibrils, and mitochondria. (f) CEL + FA-treated group showing normal myofibrils, well-defined Z-Bands, and mitochondria. (g) DOX + CEL + FA-treated group showing maintenance of myofibrillar arrangement with mild mitochondrial swelling and margination of chromatin in the nucleus (N). DOX: Doxorubicin; CEL: Celecoxib; FA: Folic acid.