Figures & data
Table 1. Rat-specific PCR primer sequences.
Figure 1. Activity of superoxide dismutase (a) and catalase (b) in different experimental groups. Each value represents mean ± SEM of six values. N: Normal; S: Selenite. Different alphabets indicate significant difference between different groups at p < 0.05. Comparison is carried out between the groups; Cataract group is compared with control group and treatment group is compared with cataract group. aindicates normal group, bindicates significantly different from normal group and cindicates significantly different from cataract group.
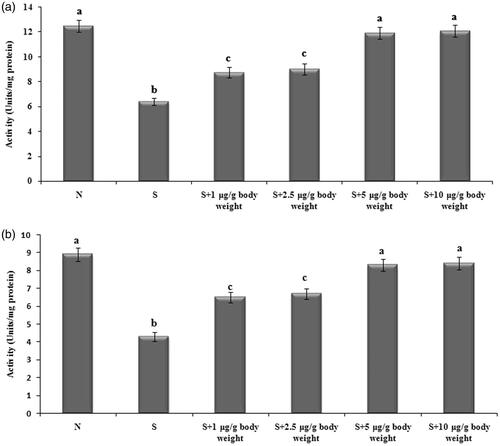
Figure 2. Activity of MPO in the lenses of experimental groups. N: Normal; S: Selenite. Each value represents mean ± SEM of six values. Different alphabets indicate significant difference between different groups at p < 0.05. Comparison is carried out between the groups; aindicates normal group, bindicates significantly different from normal group and cindicates significantly different from cataract group.
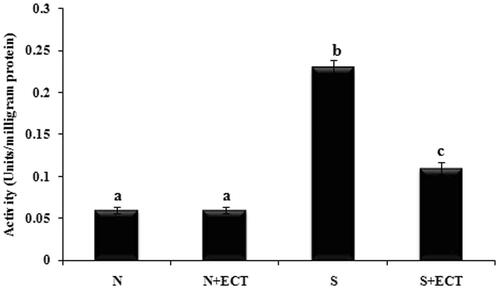
Figure 3. Activity of calpain in the lenses of experimental groups. N: Normal; S: Selenite. Each value represents mean ± SEM of six values. Different alphabets indicate significant difference between different groups at p < 0.05. Comparison is carried out between the groups; aindicates normal group, bindicates significantly different from normal group and cindicates significantly different from cataract group.
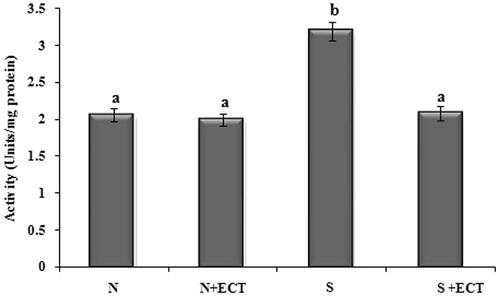
Figure 4. Photographic and graphical representation of mRNA expression of calpain and MIP in the lenses of different experimental groups. N: Normal; S: Selenite. Each value represents mean ± SEM of six values. Different alphabets indicate significant difference between different groups at p < 0.05. Comparison is carried out between the groups; Cataract group is compared with control group and treatment group is compared with cataract group. aindicates normal group, bindicates significantly different from normal group and cindicates significantly different from cataract group.
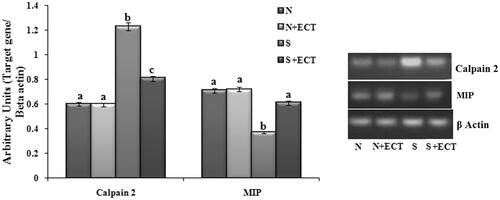
Figure 5. Photographic and graphical representation of mRNA expression of E Cadherin and N Cadherin in different experimental groups. N: Normal; S: Selenite. Each value represents mean ± SEM of six values. Different alphabets indicate significant difference between different groups at p < 0.05. Comparison is carried out between the groups; Cataract group is compared with control group and treatment group is compared with cataract group. aindicates normal group, bindicates significantly different from normal group and cindicates significantly different from cataract group.
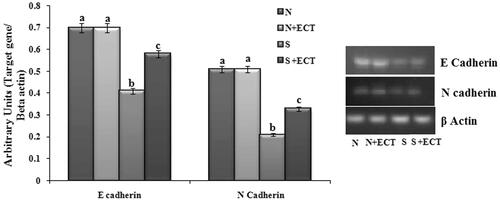
Figure 6. Photographic and graphical representation of mRNA expression of NKCC 1 in different experimental groups. N: Normal; S: Selenite. Each value represents mean ± SEM of six values. Different alphabets indicate significant difference between different groups at p < 0.05. Comparison is carried out between the groups; Cataract group is compared with control group and treatment group is compared with cataract group. aindicates normal group, bindicates significantly different from normal group and cindicates significantly different from cataract group.

Table 2. Level of sodium and potassium in the lenses of different experimental groups.
Figure 7. The level of ATP in the lenses of experimental groups. N: Normal; S: Selenite. Each value represents mean ± SEM of six values. Different alphabets indicate significant difference between different groups at p < 0.05. Comparison is carried out between the groups; aindicates normal group, bindicates significantly different from normal group and cindicates significantly different from cataract group.
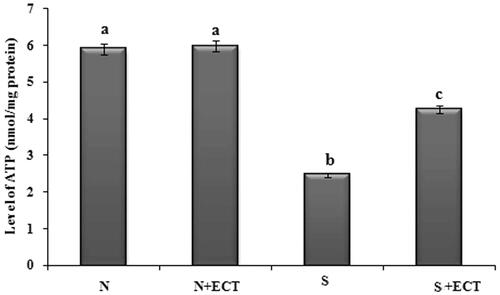
Figure 8. (A) Photographic and graphical representation of mRNA expression of CCO 1 in different experimental groups. (B) Protein expression of CCO 1 in the lenses of different experimental groups. N: Normal; S: Selenite. Each value represents mean ± SEM of six values. Different alphabets indicate significant difference between different groups at p < 0.05. Comparison is carried out between the groups; aindicates normal group, bindicates significantly different from normal group and cindicates significantly different from cataract group.
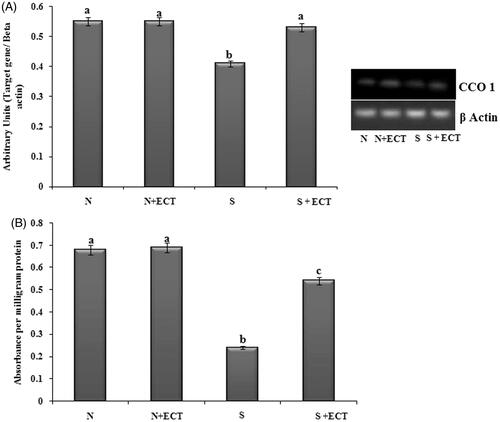
Figure 9. (A) Photographic and graphical representation of mRNA expression of Ub e1 and Ub e2 in different experimental groups. (B) Protein expression of Ub E1 in the lenses of different experimental groups. N: Normal; S: Selenite. Each value represents mean ± SEM of six values. Different alphabets indicate significant difference between different groups at p < 0.05. Comparison is carried out between the groups; Cataract group is compared with control group and treatment group is compared with cataract group. aindicates normal group, bindicates significantly different from normal group and cindicates significantly different from cataract group.
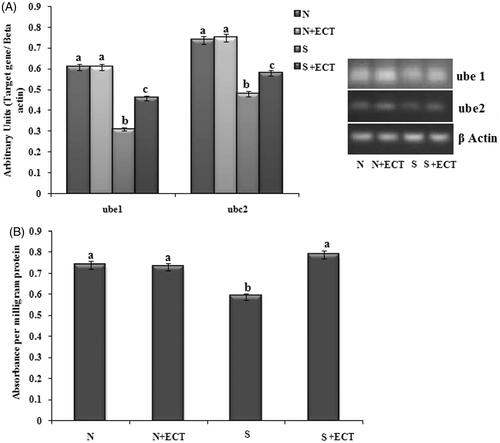
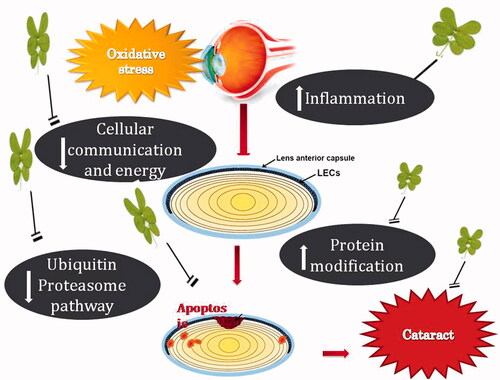
Figure 10. Biochemical events associated with the protective effect of Cassia tora in cataract.