Figures & data
Figure 1. The chromatograph chart at 354 nm (A) and the (−)-ESI total ion current (B) of Typha angustifolia.
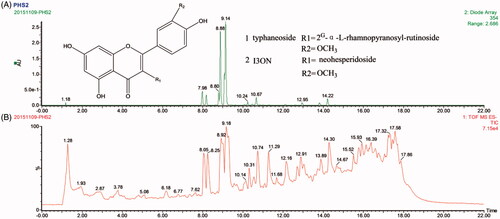
Table 1. The identification of flavone compounds in Typha angustifolia.
Figure 2. The DPPH scavenging activity (A) and Fe3+ absorbance (B) of the extract of Typha angustifolia.
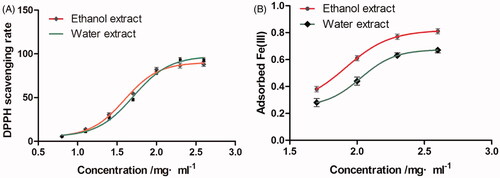
Figure 3. Effect of typhaneoside and I3ON on the activities of normal HUVECs (n = 5).
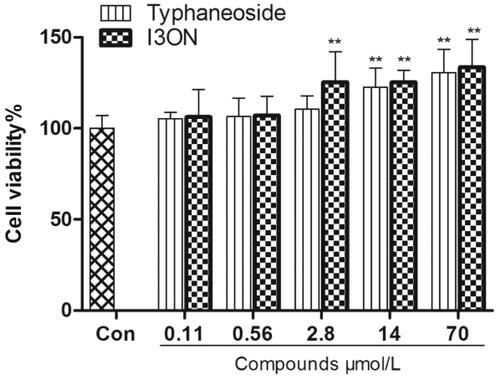
Figure 4. Effect of typhaneoside and I3ON on HUVECs stimulated with LPS. (A) normal control. (B) HUVECs was treated with of LPS (100 μg/mL) stimulation for 24 h. (C) HUVECs induced by LPS was treated with typhaneoside (70 μmol/L). (D) HUVECs induced by LPS was treated with I3ON (70 μmol/L), magnification ×200. Data are expressed as the means ± SD. (standard deviation, n = 5). #p < 0.05, ##p < 0.01 vs. sham control; *p < 0.05, **p < 0.01 vs. LPS group. Con: sham control group, LPS: LPS group.
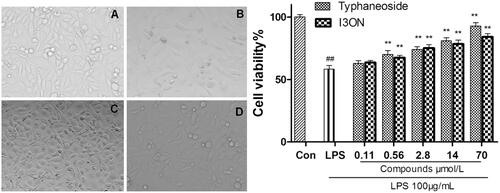
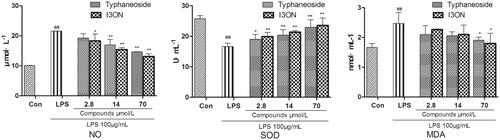
Figure 5. NO, SOD and MDA levels in all groups on HUVECs injury induced by LPS. Data are expressed as the means ± SD (n = 5). #p < 0.05, ##p < 0.01 vs. sham control; *p < 0.05, **p < 0.01 vs. LPS group. Con: sham control group, LPS: LPS group.