Figures & data
Figure 1. Effects of SH extract on TRPV3 current in TRPV3-transfected HEK293T cells. (A) Representative trace recording of ITRPV3 in response to continuous ramp-like pulse protocols in HEK293T cells stably transfected with TRPV3. Numbers in parenthesis indicate the corresponding current to voltage relationship (I/V curves) depicted in Figure 1(B). (B) I–V relationship curves before treatment with SH extract (control current, Ictrl) (1), steady-state ITRPV3 induced by SH extract (100 μg/mL) (2), and steady-state ITRPV3 induced by 2-APB (3) (n = 5). (C, D) Summary of normalized inward and outward current densities at -100 mV (C) and +100 mV (D). All data are expressed as the mean ± SEM (n = 5). Current densities were normalized (%) to 2-APB-induced ITRPV3 current (maximum current). p Values were calculated in comparison with Ictrl. p Values less than 0.05 were considered significant (****p < 0.001).
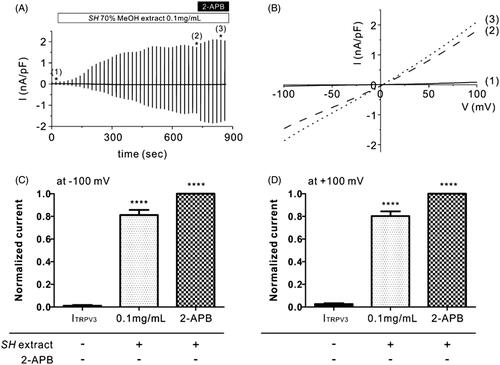
Figure 2. Effects of SH extract on Orai1 current (IOrai1) in Orai1-STIM1 co-transfected HEK293T cells. (A) Representative trace of IOrai1 in response to continuous ramp-like pulses in Orai1-STIM1 co-transfected HEK293T cells. IP3-induced IOrai1 showed transient activation and subsequent inactivation. After confirming the steady-state IOrai1, SH extract (100 μg/mL) was applied. Numbers in parenthesis by each asterisk indicate the corresponding steady-state current to voltage relationship (I/V curves) in the presence of SH extract and BTP2, which are depicted in Figure 2(B). (B) Corresponding I–V relationship curves from the data in Figure 1(A) showing steady-state IOrai1 (1) and in the presence of 0.1 mg/mL SH extract (2). (C and D) Summary of normalized IOrai1 at −120 mV. Normalized (%) current was calculated by subtracting the BTP2-resistant current (IBTP2) from the current in the presence of 0.1 mg/mL SH extract (IOrai1, SP) or steady-state peak IOrai1 in each cell. All data are expressed as the mean ± SEM (n = 5). p Values less than 0.05 were considered significant (*p < 0.05 and ***p < 0.001).
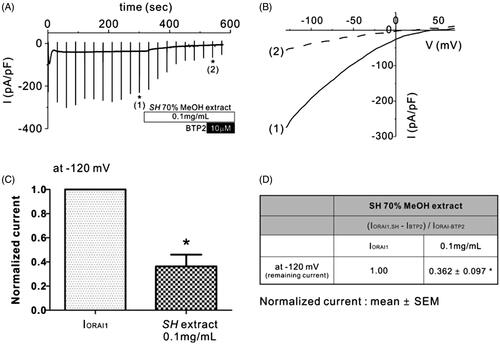
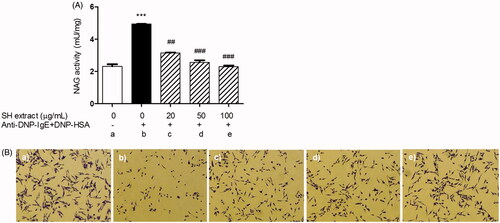
Figure 3. Effects of SH extract on beta-hexosaminidase activity and degranulation in IgE-antigen complex-stimulated RBL-2H3 cells. Cells were pretreated with SH extract at 20, 50 and 100 μg/mL for 30 min, and then stimulated with anti-DNP-IgE plus DNP-HAS for 15 min. (A) β-Hexosaminidase activity was measured using the NAG activity assay kit. All data are expressed as the mean ± SEM (n = 3). ***p < 0.001 vs. normal; ##p < 0.01 and ###p < 0.001 vs. IgE-antigen stimulated cells. (B) Morphological changes with degranulation were observed by microscopy before measurement of NAG activity (original magnification =100×). (a) Normal cells, (b) IgE-antigen stimulated cells, (c) SH extract 20 μg/mL-treated cells, (d) SH extract 50 μg/mL-treated cells, and (e) SH extract 100 μg/mL-treated cells.