
Figures & data
Figure 1. Effect of Nigella sativa methanolic extract on neurotransmitter amino acid levels in the rat thalamus after 1 h and 8 days of treatment. Data in pmol/mg of tissue are presented as mean ± SEM of five animals per group assayed in triplicate. Statistical significances are given regarding to the corresponding control: ns = no significant and *p < 0.05.
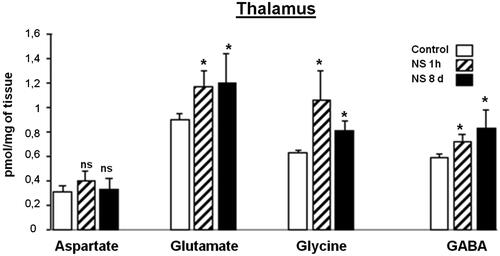
Figure 2. Effect of Nigella sativa methanolic extract on neurotransmitter amino acid levels in the rat striatum after 1 h and 8 days of treatment. Data in pmol/mg of tissue are presented as mean ± SEM of five animals per group assayed in triplicate. Statistical significances are given regarding to the corresponding control: ns = no significant and *p < 0.05.
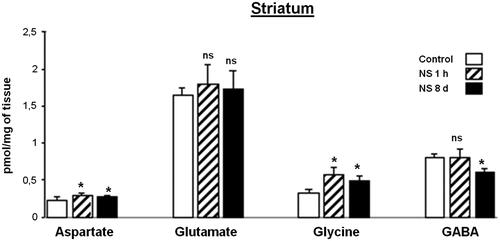
Figure 3. Effect of Nigella sativa methanolic extract on neurotransmitter amino acid levels in the rat cortex after 1 h and 8 days of treatment. Data in pmol/mg of tissue are presented as mean ± SEM of five animals per group assayed in triplicate. Statistical significances are given regarding to the corresponding control: ns = no significant, *p < 0.05 and **p < 0.01.
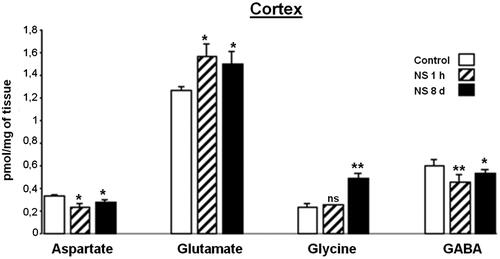
Figure 4. Effect of Nigella sativa methanolic extract on neurotransmitter amino acid levels in the rat hypothalamus after 1 h and 8 days of treatment. Data in pmol/mg of tissue are presented as mean ± SEM of five animals per group assayed in triplicate. Statistical significances are given regarding to the corresponding control: ns = no significant, *p < 0.05 and **p < 0.01.
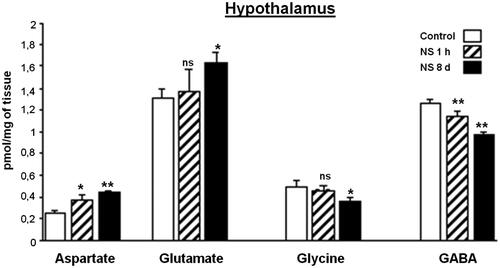
Figure 5. Effect of Nigella sativa methanolic extract on neurotransmitter amino acid levels in the rat hyppocampus after 1 h and 8 days of treatment. Data in pmol/mg of tissue are presented as mean ± SEM of five animals per group assayed in triplicate. Statistical significances are given regarding to the corresponding control: ns = no significant and *p < 0.05.
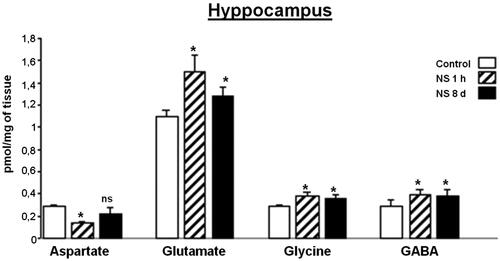
Table 1. Relative percentage of variation with regard to his value control for Asp, Glu, Gly and GABA in different brain regions using quantitative analysis.