Figures & data
Table 1. Details regarding dosage and treatment of Aβ 25–35 peptide and G. acerosa benzene extract in Swiss Albino mice.
Figure 1. Effect of G. acerosa benzene extract on Aβ 25–35-induced short-term memory by Y-maze test. The results are expressed as Mean ± SD. *p < 0.05 [Comparisons were made between groups II (Aβ 25–35 peptide treated) Vs I (Carboxy methyl cellulose (CMC) treated) & III (Aβ 25–35 peptide +200 mg/kg of extract in CMC), IV (Aβ 25–35 peptide +400 mg/kg of extract in CMC), V (400 mg/kg bw of extract), VI (Aβ 25–35 peptide + donepezil), VII (1 mg/kg bw of donepezil) Vs II (Aβ 25–35 peptide treated)].
![Figure 1. Effect of G. acerosa benzene extract on Aβ 25–35-induced short-term memory by Y-maze test. The results are expressed as Mean ± SD. *p < 0.05 [Comparisons were made between groups II (Aβ 25–35 peptide treated) Vs I (Carboxy methyl cellulose (CMC) treated) & III (Aβ 25–35 peptide +200 mg/kg of extract in CMC), IV (Aβ 25–35 peptide +400 mg/kg of extract in CMC), V (400 mg/kg bw of extract), VI (Aβ 25–35 peptide + donepezil), VII (1 mg/kg bw of donepezil) Vs II (Aβ 25–35 peptide treated)].](/cms/asset/2d985b75-27ed-435f-97ce-341c805070f3/iphb_a_1302967_f0001_b.jpg)
Figure 2. Protective effect of G. acerosa benzene extract on Aβ 25–35-induced memory impairment by water-maze test. *p < 0.05 [Comparisons were made between groups II (Aβ 25–35 peptide treated) Vs I (CMC treated) & III (Aβ 25–35 peptide +200 mg/kg of extract in CMC), IV (Aβ 25–35 peptide +400 mg/kg of extract in CMC), V (400 mg/kg bw of extract), VI (Aβ 25–35 peptide + donepezil), VII (1 mg/kg bw of donepezil) Vs II (Aβ 25–35 peptide treated)].
![Figure 2. Protective effect of G. acerosa benzene extract on Aβ 25–35-induced memory impairment by water-maze test. *p < 0.05 [Comparisons were made between groups II (Aβ 25–35 peptide treated) Vs I (CMC treated) & III (Aβ 25–35 peptide +200 mg/kg of extract in CMC), IV (Aβ 25–35 peptide +400 mg/kg of extract in CMC), V (400 mg/kg bw of extract), VI (Aβ 25–35 peptide + donepezil), VII (1 mg/kg bw of donepezil) Vs II (Aβ 25–35 peptide treated)].](/cms/asset/a035b5eb-acee-459c-bc4c-c9bc4f191e4c/iphb_a_1302967_f0002_b.jpg)
Figure 3. Effect of G. acerosa benzene extract on Aβ 25–35-induced memory impairment in mice by step-down inhibitory avoidance test. STM: short term memory; LTM: long term memory. *p < 0.05 [Comparisons were made between groups II (Aβ 25–35 peptide treated) Vs I (CMC treated) & III (Aβ 25–35 peptide +200 mg/kg of extract in CMC), IV (Aβ 25–35 peptide +400 mg/kg of extract in CMC), V (400 mg/kg bw of extract), VI (Aβ 25–35 peptide + donepezil), VII (1 mg/kg bw of donepezil) Vs II (Aβ 25–35 peptide treated)].
![Figure 3. Effect of G. acerosa benzene extract on Aβ 25–35-induced memory impairment in mice by step-down inhibitory avoidance test. STM: short term memory; LTM: long term memory. *p < 0.05 [Comparisons were made between groups II (Aβ 25–35 peptide treated) Vs I (CMC treated) & III (Aβ 25–35 peptide +200 mg/kg of extract in CMC), IV (Aβ 25–35 peptide +400 mg/kg of extract in CMC), V (400 mg/kg bw of extract), VI (Aβ 25–35 peptide + donepezil), VII (1 mg/kg bw of donepezil) Vs II (Aβ 25–35 peptide treated)].](/cms/asset/fed5f6f7-8a41-444e-b7cd-9a94c504d08d/iphb_a_1302967_f0003_b.jpg)
Figure 4. Gelidiella acerosa benzene extract restores the alteration in the level of catalase (A) and SOD (B) activity in mice treated with Aβ 25–35. *p < 0.05 [Comparisons were made between groups II (Aβ 25–35 peptide treated) Vs I (CMC treated) & III (Aβ 25–35 peptide +200 mg/kg of extract in CMC), IV (Aβ 25–35 peptide +400 mg/kg of extract in CMC), V (400 mg/kgbw of extract), VI (Aβ 25–35 peptide + donepezil), VII (1 mg/kg bw of donepezil) Vs II (Aβ 25–35 peptide treated)].
![Figure 4. Gelidiella acerosa benzene extract restores the alteration in the level of catalase (A) and SOD (B) activity in mice treated with Aβ 25–35. *p < 0.05 [Comparisons were made between groups II (Aβ 25–35 peptide treated) Vs I (CMC treated) & III (Aβ 25–35 peptide +200 mg/kg of extract in CMC), IV (Aβ 25–35 peptide +400 mg/kg of extract in CMC), V (400 mg/kgbw of extract), VI (Aβ 25–35 peptide + donepezil), VII (1 mg/kg bw of donepezil) Vs II (Aβ 25–35 peptide treated)].](/cms/asset/83de61c5-d94c-4d10-8ffc-3fb4d80193bb/iphb_a_1302967_f0004_b.jpg)
Figure 5. Effect of G. acerosa benzene extract on Aβ 25–35 induced alteration in the level of glutathione-S-transferase (GST) and glutathione peroxidase (GPx) (A), glutathione reductase (GR) and glutathione (B). *p < 0.05 [Comparisons were made between groups II (Aβ 25–35 peptide treated) Vs I (CMC treated) & III (Aβ 25–35 peptide +200 mg/kg of extract in CMC), IV (Aβ 25–35 peptide +400 mg/kg of extract in CMC), V (400 mg/kg bw of extract), VI (Aβ 25–35 peptide + donepezil), VII (1 mg/kg bw of donepezil) Vs II (Aβ 25–35 peptide treated)].
![Figure 5. Effect of G. acerosa benzene extract on Aβ 25–35 induced alteration in the level of glutathione-S-transferase (GST) and glutathione peroxidase (GPx) (A), glutathione reductase (GR) and glutathione (B). *p < 0.05 [Comparisons were made between groups II (Aβ 25–35 peptide treated) Vs I (CMC treated) & III (Aβ 25–35 peptide +200 mg/kg of extract in CMC), IV (Aβ 25–35 peptide +400 mg/kg of extract in CMC), V (400 mg/kg bw of extract), VI (Aβ 25–35 peptide + donepezil), VII (1 mg/kg bw of donepezil) Vs II (Aβ 25–35 peptide treated)].](/cms/asset/ad5fa354-5516-438b-bc74-f690d5991500/iphb_a_1302967_f0005_b.jpg)
Figure 6. Effect of G. acerosa benzene extract on Aβ 25–35-induced lipid peroxidation in brain. The values are expressed as Mean ± SD. *p < 0.05 [Comparisons were made between groups II (Aβ 25–35 peptide treated) Vs I (CMC treated) & III (Aβ 25–35 peptide +200 mg/kg of extract in CMC), IV (Aβ 25–35 peptide +400 mg/kg of extract in CMC), V (400 mg/kg bw of extract), VI (Aβ 25–35 peptide + donepezil), VII (1 mg/kg bw of donepezil) Vs II (Aβ 25–35 peptide treated)].
![Figure 6. Effect of G. acerosa benzene extract on Aβ 25–35-induced lipid peroxidation in brain. The values are expressed as Mean ± SD. *p < 0.05 [Comparisons were made between groups II (Aβ 25–35 peptide treated) Vs I (CMC treated) & III (Aβ 25–35 peptide +200 mg/kg of extract in CMC), IV (Aβ 25–35 peptide +400 mg/kg of extract in CMC), V (400 mg/kg bw of extract), VI (Aβ 25–35 peptide + donepezil), VII (1 mg/kg bw of donepezil) Vs II (Aβ 25–35 peptide treated)].](/cms/asset/3d60ee97-75dc-4367-8c31-0ecbc7e1abca/iphb_a_1302967_f0006_b.jpg)
Figure 7. Effect of G. acerosa benzene extract on Aβ 25–35-induced protein carbonyl content production in mice brain. The values are expressed as Mean ± SD. *p < 0.05 [Comparisons were made between groups II (Aβ 25–35 peptide treated) Vs I (CMC treated) & III (Aβ 25–35 peptide +200 mg/kg of extract in CMC), IV (Aβ 25–35 peptide +400 mg/kg of extract in CMC), V (400 mg/kg bw of extract), VI (Aβ 25–35 peptide + donepezil), VII (1 mg/kg bw of donepezil) Vs II (Aβ 25–35 peptide treated)].
![Figure 7. Effect of G. acerosa benzene extract on Aβ 25–35-induced protein carbonyl content production in mice brain. The values are expressed as Mean ± SD. *p < 0.05 [Comparisons were made between groups II (Aβ 25–35 peptide treated) Vs I (CMC treated) & III (Aβ 25–35 peptide +200 mg/kg of extract in CMC), IV (Aβ 25–35 peptide +400 mg/kg of extract in CMC), V (400 mg/kg bw of extract), VI (Aβ 25–35 peptide + donepezil), VII (1 mg/kg bw of donepezil) Vs II (Aβ 25–35 peptide treated)].](/cms/asset/c68f75c7-87d1-4c82-8a90-cbdeaf38c8c3/iphb_a_1302967_f0007_b.jpg)
Figure 8. Inhibitory effect of G. acerosa benzene extract on Aβ 25–35 induced increase in acetylcholinesterase (AChE) and butyrylcholinesterase (BuChE) activities in mice brain tissue homogenate. The values are expressed as Mean ± SD. *p < 0.05 [Comparisons were made between groups II (Aβ 25–35 peptide treated) Vs I (CMC treated) & III (Aβ 25–35 peptide +200 mg/kg of extract in CMC), IV (Aβ 25–35 peptide +400 mg/kg of extract in CMC), V (400 mg/kg bw of extract), VI (Aβ 25–35 peptide + donepezil), VII (1 mg/kg bw of donepezil) Vs II (Aβ 25–35 peptide treated)].
![Figure 8. Inhibitory effect of G. acerosa benzene extract on Aβ 25–35 induced increase in acetylcholinesterase (AChE) and butyrylcholinesterase (BuChE) activities in mice brain tissue homogenate. The values are expressed as Mean ± SD. *p < 0.05 [Comparisons were made between groups II (Aβ 25–35 peptide treated) Vs I (CMC treated) & III (Aβ 25–35 peptide +200 mg/kg of extract in CMC), IV (Aβ 25–35 peptide +400 mg/kg of extract in CMC), V (400 mg/kg bw of extract), VI (Aβ 25–35 peptide + donepezil), VII (1 mg/kg bw of donepezil) Vs II (Aβ 25–35 peptide treated)].](/cms/asset/6a8c322e-da17-41b6-837f-b30a826a34bb/iphb_a_1302967_f0008_b.jpg)
Figure 9. Inhibitory effect of G. acerosa benzene extract on Aβ 25–35 induced increase in β-secretase activity in mice brain tissue homogenate. The values are expressed as Mean ± SD. *p < 0.05 [Comparisons were made between groups II (Aβ 25–35 peptide treated) Vs I (CMC treated) & III (Aβ 25–35 peptide +200 mg/kg of extract in CMC), IV (Aβ 25–35 peptide +400 mg/kg of extract in CMC), V (400 mg/kg bw of extract), VI (Aβ 25–35 peptide + donepezil), VII (1 mg/kg bw of donepezil) Vs II (Aβ 25–35 peptide treated)].
![Figure 9. Inhibitory effect of G. acerosa benzene extract on Aβ 25–35 induced increase in β-secretase activity in mice brain tissue homogenate. The values are expressed as Mean ± SD. *p < 0.05 [Comparisons were made between groups II (Aβ 25–35 peptide treated) Vs I (CMC treated) & III (Aβ 25–35 peptide +200 mg/kg of extract in CMC), IV (Aβ 25–35 peptide +400 mg/kg of extract in CMC), V (400 mg/kg bw of extract), VI (Aβ 25–35 peptide + donepezil), VII (1 mg/kg bw of donepezil) Vs II (Aβ 25–35 peptide treated)].](/cms/asset/b80f2e1b-6103-4e29-a0d2-f9c1b8ca906c/iphb_a_1302967_f0009_b.jpg)
Figure 10. Inhibitory effect of G. acerosa benzene extract on Aβ 25–35 induced increase in monoamine oxidase activity in mice brain tissue homogenate. The values are expressed as Mean ± SD. *p < 0.05 [Comparisons were made between groups II (Aβ 25–35 peptide treated) Vs I (CMC treated) & III (Aβ 25–35 peptide +200 mg/kg of extract in CMC), IV (Aβ 25–35 peptide +400 mg/kg of extract in CMC), V (400 mg/kg bw of extract), VI (Aβ 25–35 peptide + donepezil), VII (1 mg/kg bw of donepezil) Vs II (Aβ 25–35 peptide treated)].
![Figure 10. Inhibitory effect of G. acerosa benzene extract on Aβ 25–35 induced increase in monoamine oxidase activity in mice brain tissue homogenate. The values are expressed as Mean ± SD. *p < 0.05 [Comparisons were made between groups II (Aβ 25–35 peptide treated) Vs I (CMC treated) & III (Aβ 25–35 peptide +200 mg/kg of extract in CMC), IV (Aβ 25–35 peptide +400 mg/kg of extract in CMC), V (400 mg/kg bw of extract), VI (Aβ 25–35 peptide + donepezil), VII (1 mg/kg bw of donepezil) Vs II (Aβ 25–35 peptide treated)].](/cms/asset/15a7e966-e544-4ea3-b6fb-9323a5304e23/iphb_a_1302967_f0010_b.jpg)
Figure 11. Inhibitory effect of G. acerosa benzene extract on Aβ 25–35 induced increase in caspase-3 activity in mice brain tissue homogenate. The values are expressed as Mean ± SD. *p < 0.05 [Comparisons were made between groups II (Aβ 25–35 peptide treated) Vs I (CMC treated) & III (Aβ 25–35 peptide +200 mg/kg of extract in CMC), IV (Aβ 25–35 peptide +400 mg/kg of extract in CMC), V (400 mg/kg bw of extract), VI (Aβ 25–35 peptide + donepezil), VII (1 mg/kg bw of donepezil) Vs II (Aβ 25–35 peptide treated)].
![Figure 11. Inhibitory effect of G. acerosa benzene extract on Aβ 25–35 induced increase in caspase-3 activity in mice brain tissue homogenate. The values are expressed as Mean ± SD. *p < 0.05 [Comparisons were made between groups II (Aβ 25–35 peptide treated) Vs I (CMC treated) & III (Aβ 25–35 peptide +200 mg/kg of extract in CMC), IV (Aβ 25–35 peptide +400 mg/kg of extract in CMC), V (400 mg/kg bw of extract), VI (Aβ 25–35 peptide + donepezil), VII (1 mg/kg bw of donepezil) Vs II (Aβ 25–35 peptide treated)].](/cms/asset/b7bcd1d5-48ba-4a8e-b899-d64db60937a7/iphb_a_1302967_f0011_b.jpg)
Figure 12. Representative western blot images showing the effect of G. acerosa benzene extract on the expression levels of Bax and BCl-2 in mice brain tissue homogenates (A). Quantified results of the expression pattern of Bax (B) and BCl-2 (C).
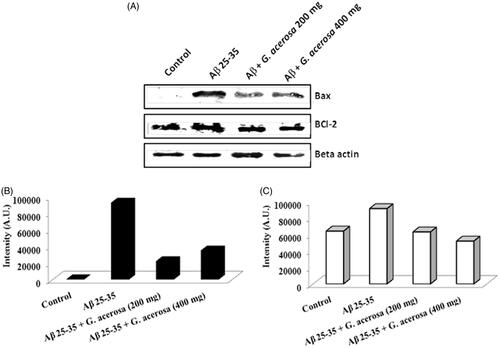
Table 2. Organ weight of mice treated with G. acerosa benzene extract (2000 mg/kg of BW).
Table 3. Haematological profile of mice treated with G. acerosa benzene extract (2000 mg/kg of BW).
Figure 13. Histopathological analysis of the effect of G. acerosa on mice treated with 2000 mg/kg bw. A, B, C & D – Control group; E, F, G, H – G. acerosa-treated group. A&E- ![]()
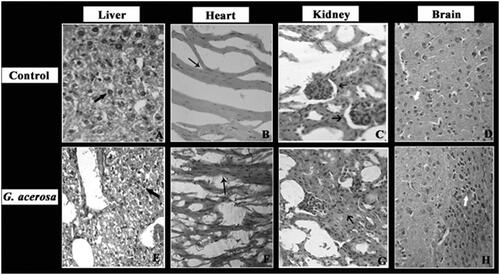
Table 4. Biochemical profile of mice treated with G. acerosa benzene extract (2000 mg/kg of BW).
Table 5. Organ weight of mice treated with G. acerosa benzene extracts (200 and 400 mg/kg of BW).
Table 6. Haematological profile of mice treated with G. acerosa benzene extract (200 and 400 mg/kg of BW).
Table 7. Biochemical profile of mice treated with G. acerosa benzene extract (200 and 400 mg/kg of BW).
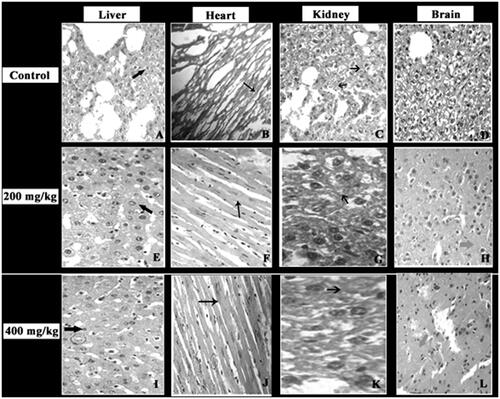
Figure 14. Histopathological analysis of the effect of G. acerosa on mice treated with 200 and 400 mg/kg bw. A, B, C, & D – Control group; E,F,G&H – 200 mg/kg bw G. acerosa-treated group, IJKL - 400 mg/kg bw G. acerosa treated group. A,E & I ![]()