Figures & data
Table 1. Antibiotic-resistance profile of C. albicans clinical strains isolated from vaginal secretion samples.
Table 2. Phytochemical analysis of B. tetraphylla leaves extracts.
Table 3. The anti-Candida albicans activity of extracts from B. tetraphylla leaves.
Figure 1. Combinatory effects of BTME and fluconazole against Candida albicans. non: non-interactive effect; add: additive effect; syn: synergistic effect; ant: antagonistic effect.
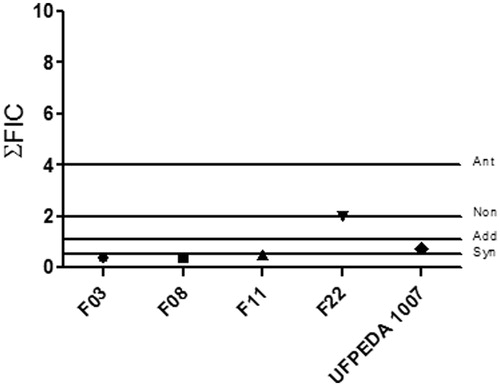
Figure 2. Effects of BTME on C. albicans. (a–c) Control cells; (d–f) cells treated with BTME at MIC for 12 h. (a–c) Ultrastructural aspects of untreated C. albicans culture at low (a) and high magnification (b–c) showing the presence of single and budding yeast cells with evident fragile blastoconidial septum (white arrow). (h) True hyphal structures could be also observed. Treated C. albicans culture at (d) low and (e–f) high magnifications. Note in (e) the presence of elongated cells (white asterisk) with multiple scars (white arrow). (f) Cells presenting surface depressions are indicated in white arrow.
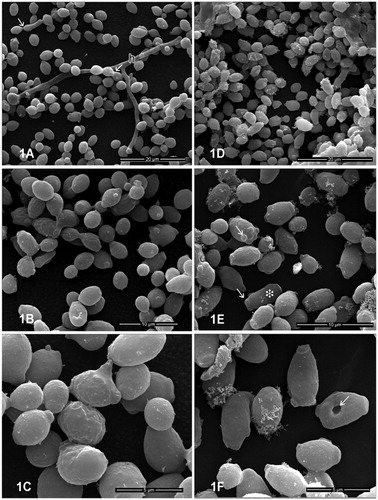
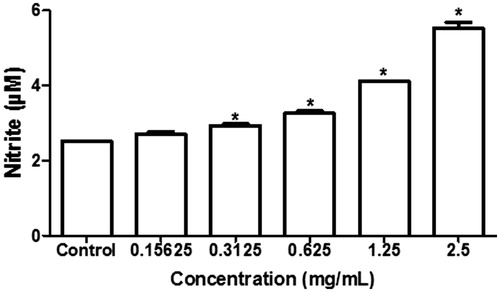
Figure 3. Effect of BTME on nitric oxide production by J774 macrophages. *Significant differences in relation to control (p < 0.05).