Figures & data
Table 1. Chemical composition of Moringa oleifera leaves ethanol extract.
Table 2. Bio-active compounds of Moringa oleifera ethanol extract.
Table 3. The bioactive oil of MOLEE.
Table 4. Nucleotide sequences of the primers used in RT-PCR
Figure 1. Changes of rat body weight. The data of body weight are presented as the mean ± S.E. (p < 0.05).
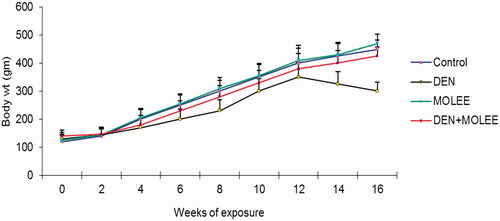
Table 5. Effect of MOLEE and DEN on body and liver weights of different groups of rats.
Figure 2. Effect of MOLEE on hepatic morphology, histology (HE staining, ×200) and changes of nodule incidence and average number of nodules per nodule-bearing liver in rats. The data are presented as the mean ± S.E. (p < 0.05).
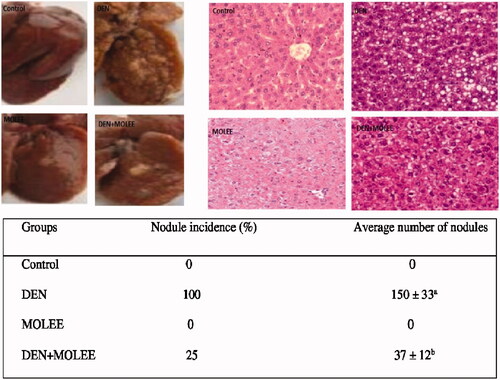
Table 6. Effect of MOLEE and DEN on serum specific liver enzyme activities in rats.
Table 7. Effect of MOLEE and DEN on protein pattern and MDA in rats.
Figure 3. The content of 8-OHdG in liver DNA. The data are presented as the mean ± S.E. Columns with different letters are significantly different (p < 0.05).
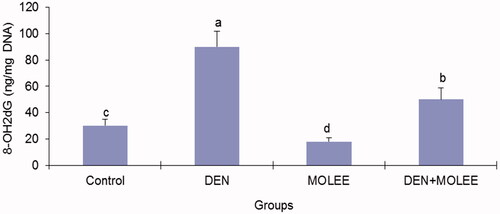
Figure 4. Effect of MOLEE on the level of AFP and CEA in the serum of control and experimental rats. The data were presented as the mean ± S.E. Columns with different letters are significantly different (p < 0.05). AFP and CEA levels are expressed as ng/mL.
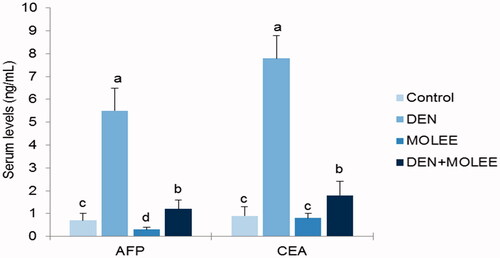
Table 8. Effect of MOLEE and DEN on oxidant/antioxidant status in rats.
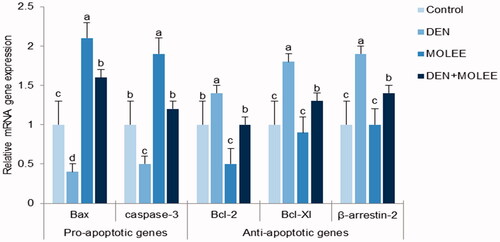
Figure 5. Effect of MOLEE and DEN on the mRNA levels of Bcl-2, Bcl-XL, Bax, caspase-3 and β-arrestin. The mRNA levels were quantified with GAPDH as an internal control. The data were presented as the mean ± S.E. Columns with different letters are significantly different (P < 0.05).