Figures & data
Figure 1. Anti-DHAV-1 reproduction effect of BLIN. When DEHs were infected with DHAV-1, BLIN at different working concentrations (20, 10, 5 and 2.5 μg/mL) was added to DEHs, five repetitions per treatment. After 24 h, the qRT-PCR method was used to measure the DHAV-1 reproduction level. Statistical analyses were performed using Duncan’s multiple range tests. a–dBars in the figure without the same superscripts differ significantly (p < 0.05). ND: not detected.
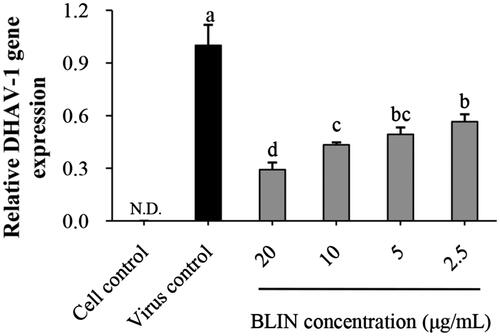
Figure 2. Influence of BLIN on DHAV-1 adsorption, replication and release. Two sample-adding modes, pre-adding drug (A) and post-adding drug (B) were used to observe the influence of BLIN on DHAV-1 adsorption. The assay in each mode was repeated five times. (C) To observe the influence of BLIN on DHAV-1 replication, DHAV-1 was added to DEHs for 2 h to allow adsorption and penetration of the virus, and then BLIN at 20 μg/mL was added to DEHs for 10 h, five repetitions per treatment. (D) To observe the influence of BLIN on DHAV-1 release, DHAV-1 was added to DEHs for 32 h to allow adsorption, penetration, replication and release, and then BLIN at 20 μg/mL was added to DEHs for 1 h, five repetitions per treatment. The qRT-PCR method was used to measure the relative DHAV-1 gene expression. Statistical analyses were performed by t tests. ND: not detected; *Compared with virus control, p < 0.05; **Compared with virus control, p < 0.01.
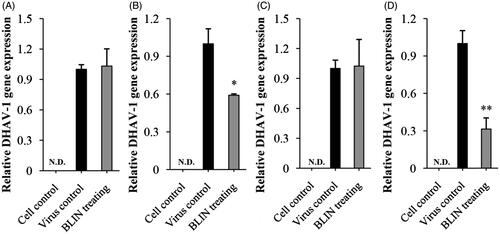
Figure 3. Influence of BLIN on lymphocyte proliferation. PHA, as a control was used to stimulate the T lymphocyte. (A) BLIN at different working concentrations (20, 10, 5 and 2.5 μg/mL) stimulated T lymphocytes singly or co-stimulated with PHA, five repetitions per treatment. LPS, as a control, was used to stimulate the B lymphocyte. (B) BLIN at different working concentrations (20, 10, 5 and 2.5 μg/mL) stimulated B lymphocytes singly or co-stimulated with LPS, five repetitions per treatment. Statistical analyses were performed using Duncan’s multiple range tests. a–eBars in the figure without the same superscripts differ significantly (p < 0.05).
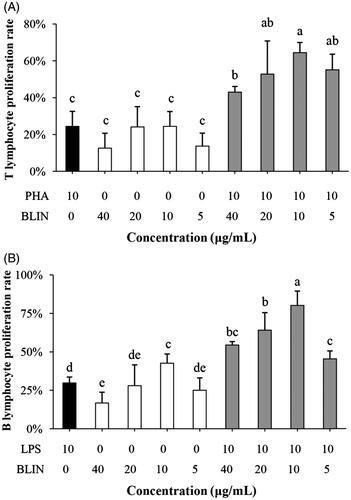
Figure 4. Influence of BLIN on the expression of IL-2 and IFN-γ mRNA. BLIN at 5 μg/mL was used to treat the B lymphocyte for 48 h. Then, the expression of IL-2 and IFN-γ mRNA was detected by qRT-PCR.
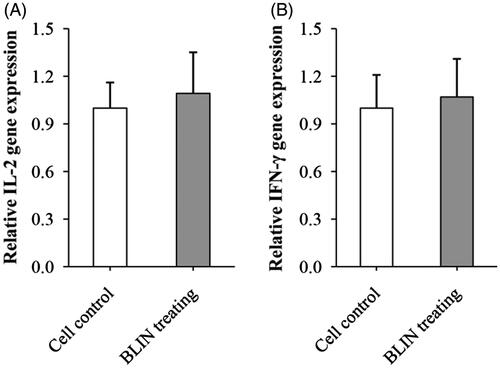
Figure 5. Influence of BLIN on IL-2 and IFN-γ secretion. After treatment with DHAV-1 for (A,D) 4, (B,E) 8 or (C,F) 54 h, the blood of ducklings in the blank control, virus control and BLIN treatment groups (five samples per group) was collected. The serum was separated, then IL-2 (A–C) and IFN-γ (D–F) levels were determined by an ELISA kit. Statistical analyses were performed using Duncan’s multiple range tests.
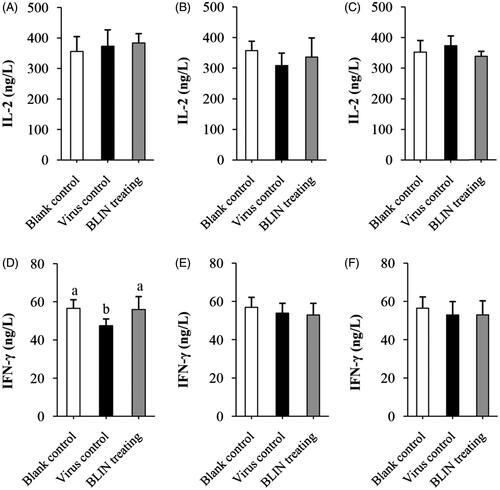
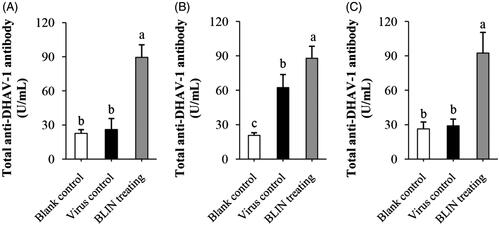
Figure 6. Influence of BLIN on total anti-DHAV-1 antibody secretion. After injecting DHAV-1 for (A) 4, (B) 8 or (C) 54 h, the blood of ducklings in the blank control, virus control and BLIN treatment groups (five samples per group) was collected. The serum was separated and total anti-DHAV-1 antibody levels were determined by an ELISA kit. Statistical analyses were performed using Duncan’s multiple range tests. a–cBars in the figure without the same superscripts differ significantly (p < 0.05).