Figures & data
Table 1. IC50 values and tumour specificity rate for compounds.
Figure 1. Isolated compounds from O. rotundifolium.
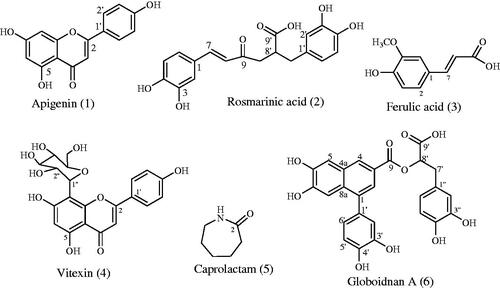
Figure 2. DPPH• scavenging, ABTS•+ scavenging and reducing power activities of isolated compounds and positive controls. (The same letters on the columns of DPPH and ABTS revealed that the differences are not significant statistically (p > 0.05). The different letters indicated that the differences are significant (p < 0.05).
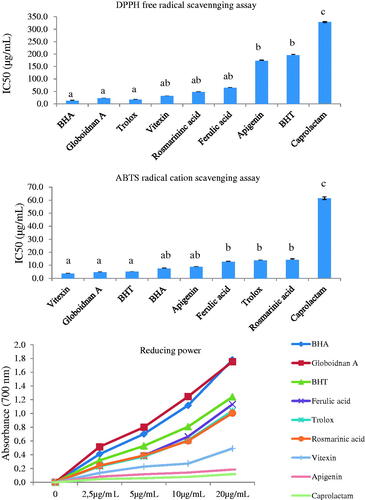
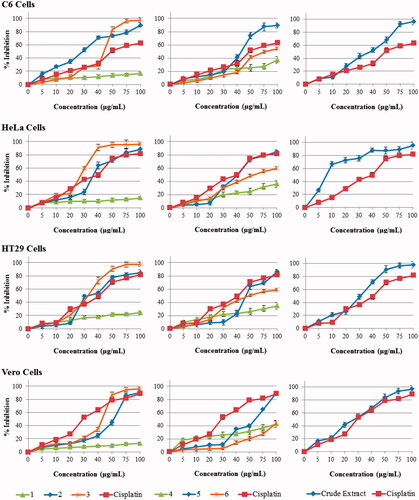
Figure 3. The antiproliferative activity of compounds on C6, HeLa, HT29 and Vero cell lines. Cell proliferation was measured using a BrdU Cell Elisa Assay Kit. Percent inhibition was reported as mean values ± SEM of three independent assays (p < 0.05). Each experiment was repeated three times for each cell line.