Figures & data
Figure 1. The cell viability assay in HSC-T6 and morphological changes in primary HSCs on treatment with ABE. (A) HSC-T6 cells were incubated with ABE at indicated concentrations for 24 h and the cell viability was determined by MTT assay. (B) Primary HSCs were cultivated for 1 week and exposed to the ABE 0.1 mg/mL for 24 h. Pictures were taken after 24 h treatment with ABE. Magnification was 100X. Arrows indicate HSCs. The data are expressed as means ± SEM (n = 6), using one-way analysis of variance (ANOVA) followed by Student’s t-test. ***p < 0.001, compared with control group. NS: Not significant compared with control group.
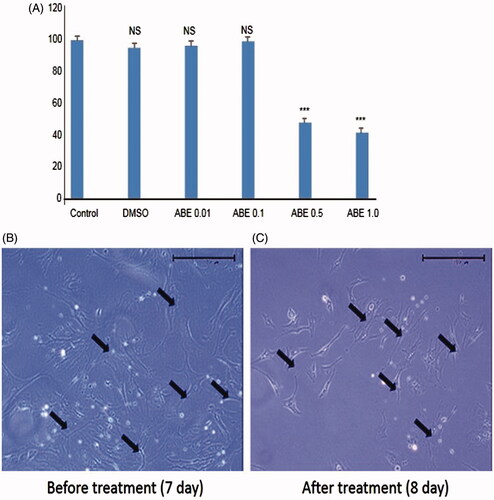
Figure 2. Effect of ABE on the cell cycle in HSC-T6 cells. DNA contents in different phases of the cell cycle were measured using propidium iodide by flow cytometry. The cell cycle distribution and the percentage of the cell cycle distribution were represented by graphs (A) and histogram (B), respectively.
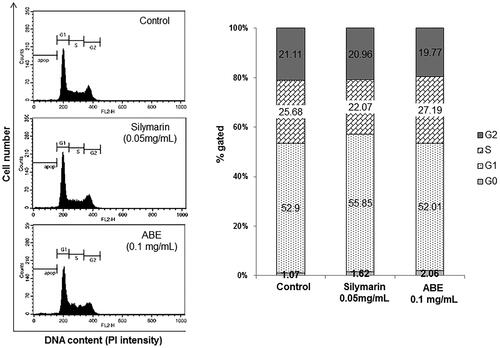
Figure 3. Effect of ABE on apoptosis and fibrosis expression in HSC-T6 cells. (A) Control cells. Flow cytometric data indicate apoptosis in HSC-T6 cells after incubation with Silymarin (B), ABE 0.1 mg/mL (C) for 24 h. (D) Data showed the apoptotic (Annexin V+ and PI−) and late apoptotic (Annexin V+ and PI+) cells. (E) Fibrosis related gene expression. The data are represented as mean ± SEM (n = 6) using one-way analysis of variance (ANOVA) followed by Student’s t-test. *p < 0.05, **p < 0.01 and ***p < 0.001, as compared with control group.
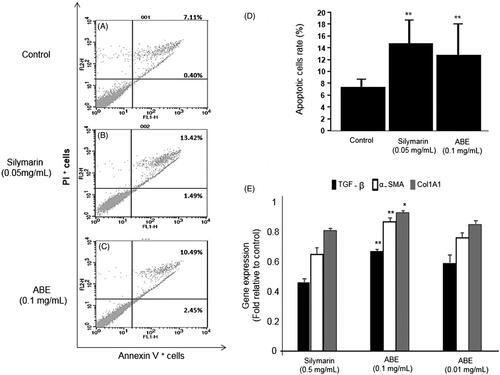
Figure 4. Effect of ABE on AST/ALT levels, total glutathione (GSH) content and hydroxyproline levels in TAA-induced liver fibrosis rats. (A) HSC-T6 cells were incubated with ABE 0.1 and 0.01 mg/mL for 24 h. Fibrosis-related genes expression in HSC-T6 cells were determined by real-time PCR. The results are expressed as normalized fold values relative to the control. Levels of AST (A) and ALT (B) in serum were measured using spectrophotometry. (C) Total GSH contents in liver tissue were measured using spectrophotometry. (D) Hydroxyproline levels from TAA-induced liver tissue of rats. TAA: Thioacetamide-induced liver fibrosis rats, Silymarin: Positive control rats, ABE 100: ABE 100 mg/kg treated rats, ABE 10: ABE 10 mg/kg treated rats. The data are expressed as means ± SEM (n = 6) using one-way analysis of variance (ANOVA) followed by Student’s t-test. ###p < 0.001 as compared with control group, *p < 0.05, **p < 0.01, ***p < 0.001 as compared with TAA group.
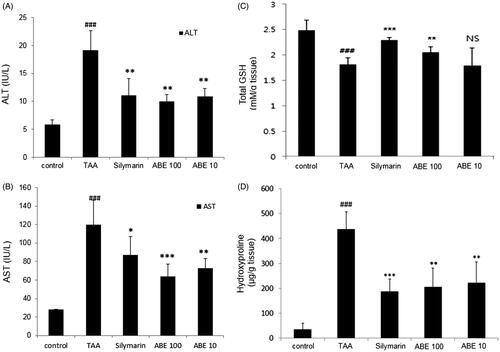
Figure 5. Haematoxylin and eosin stain of liver tissues. At the end of the experiment, all of the animals were sacrificed and livers were fixed in Bouin’s solution. After staining with haematoxylin and eosin, liver sections were taken under light microscopy. Control: naive rats (A), TAA: TAA-induced liver fibrosis rats (B), Silymarin: Positive control rats (C), ABE 100: ABE 100 mg/kg treated rats (D), ABE 10: ABE 10 mg/kg treated rats (E), Scale bar =200 μM.
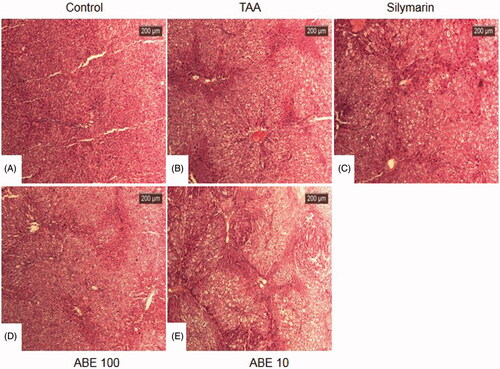
Figure 6. Masson’s trichrome stain of liver tissues. This stain was performed like H&E stain. Control: naive rats (A), TAA: TAA-induced liver fibrosis rats (B), Silymarin: Positive control rats (C), ABE 100: ABE 100 mg/kg treated rats (D), ABE 10: ABE 10 mg/kg treated rats (E), Fibrosis are plot (F). Scale bar =200 μM. Quantification was done using ImageJ. Values are represented as mean ± SEM (n = 6) using one-way analysis of variance (ANOVA) followed by Student’s t-test. #p < 0.05 as compared with control group, **p < 0.01, ***p < 0.001 as compared with TAA group. TAA: Thioacetamide-induced liver fibrosis rats, Silymarin: Positive control rats, ABE 100: ABE 100 mg/kg treated rats, ABE 10: ABE 10 mg/kg treated rats.
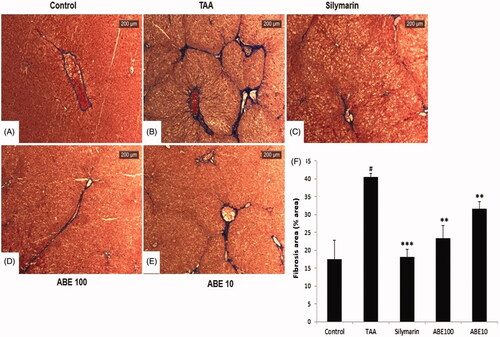
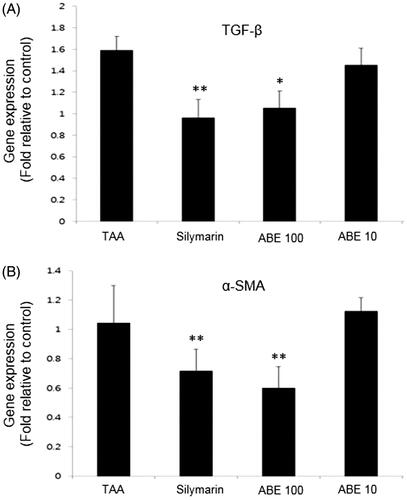
Figure 7. Fibrosis-related gene expression analysis in the liver tissues. Fibrosis related gene expressions of liver tissue were determined by real-time PCR. (A) TGF-β, (B) α-SMA. The results are expressed as normalized fold values relative to the control. Values are represented as mean ± SEM (n = 6) using one-way analysis of variance (ANOVA) followed by Student’s t-test. *p < 0.05, **p < 0.01, ***p < 0.001 as compared to TAA group. TAA: Thioacetamide-induced liver fibrosis rats, Silymarin: Positive control rats, ABE 100: ABE 100 mg/kg treated rats, ABE 10: ABE 10 mg/kg treated rats.