Figures & data
Figure 1. In vitro effects of the S. edule var. nigrum spinosum extract on the proliferation of the P388 leukemia cell line and mononuclear bone marrow cells of healthy mice (MNCBMs). The cells were exposed to the S. edule var. nigrum spinosum extract, and the cellular proliferation was evaluated using a crystal violet assay. The data are presented as the means ± SDs (n = 4) and are representative of four independent experiments. The significance of the differences were determined by Tukey’s test (p ≤ 0.05).
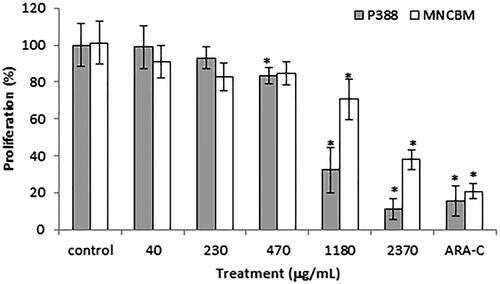
Table 1. Percentage of viability and apoptosis of P388 and bone marrow mononuclear cells from mice.
Table 2. Spleen, liver and thymic indexes of healthy mice treated i.p. with the S.e. nigrum spinosum extract at a dose of 800 mg/kg.
Table 3. Blood biochemistry of healthy mice treated with the S.e. nigrum spinosum extract at a dose of 800 mg/kg.
Table 4. Blood count of healthy mice treated with the S.e. nigrum spinosum extract at a dose of 800 mg/kg.
Figure 2. Differential peripheral blood counts of healthy mice treated with the S. edule var. nigrum spinosum extract at a dose of 800 mg/kg. n = 20 mice per treatment. The data are presented as the means ± SDs; *indicates a significant difference (Tukey’s test, p ≤ 0.05).
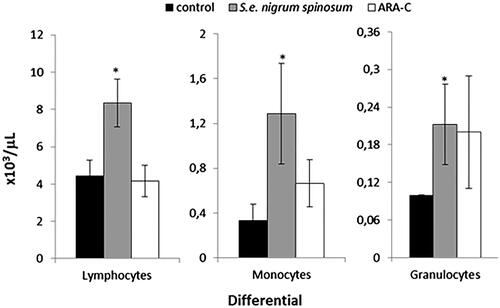
Figure 3. Mitotic index (MI) of bone marrow cells from healthy mice treated with the S. edule var. nigrum spinosum extract at a dose of 800 mg/kg. n = 20 mice per treatment. The data are presented as the means ± SDs; *indicates a significant difference (Tukey’s test, p ≤ 0.05).
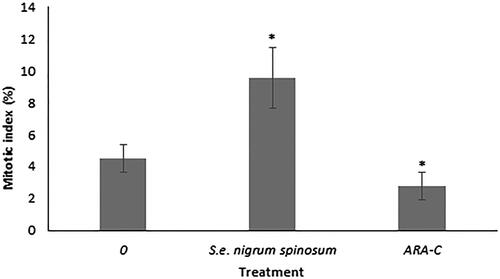
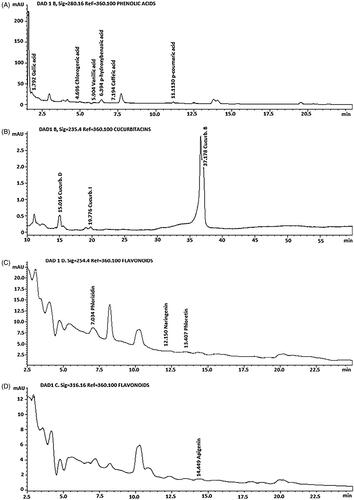
Figure 4. Representative high-performance liquid chromatography (HPLC) chromatogram of the S. edule var. nigrum spinosum extract: (A) phenolic acids, (B) cucurbitacins C and D, and (C) flavonoids.