Figures & data
Figure 1. Antifungal activity of E. giganteum extracts against C. albicans. Mean ± S.D. of viable cells (Logarithm of colony forming units per cm2) remaining on the surface of resin specimens after different pretreatments with extract: 4–50 mg/mL, or PBS (CTRL/PBS) or 1% sodium hypochlorite (CTRL/NaOCl), for 10 min. Data were obtained from analysis of 12 specimens for each group. *p < 0.05 compared to the control (CTRL/PBS).
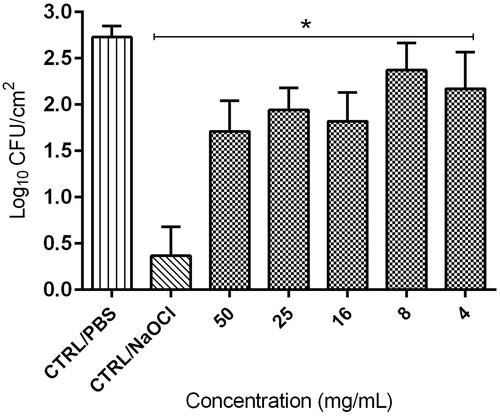
Table 1. Comparison of results from CV and CFU assays, and reduction of viable cells in relation to Control (CTRL/PBS), observed in biofilms remaining on the surface of the resin specimens after different pretreatments with extract: 4–50 mg/mL, or PBS (CTRL/PBS) or 1% sodium hypochlorite (CTRL/NaOCl), for 10 min.
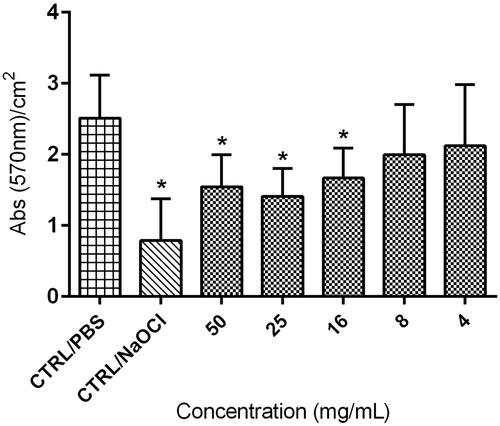
Figure 2. Mean absorbance values per cm2 obtained by CV assay on biofilms remaining on the surface of resin specimens after different pretreatments with extract: 4–50 mg/mL, or PBS (CTRL/PBS) or 1% sodium hypochlorite (CTRL/NaOCl), for 10 min. *p < 0.05 compared to the control (CTRL/PBS).