Figures & data
Figure 1. Effects of epigallocatechin-3-gallate (EG) on serum testosterone, and testicular malondialdehyde (MDA), total antioxidant status (TAS), nitric oxide (NO); interlekin-6 (IL-6), and interlekin-1β (IL-1β) in rats exposed to cisplatin (CN) testicular injury. Results are mean ± S.E.M., *p < 0.05 vs. control group, ▪p < 0.05 vs. CN group, ≠p < 0.05 vs. epigallocatechin-3-gallate 40 mg/kg (EG 40) + CN group.
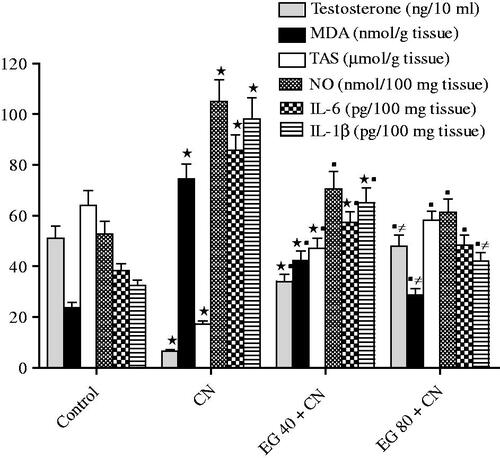
Figure 2. Effects of epigallocatechin-3-gallate (EG) on cytosolic cytochrome C (Cyt C), Bax/Bcl-2 ratio, and caspase-3 in rats exposed to cisplatin (CN) testicular injury. Results are mean ± S.E.M., *p < 0.05 vs. control group, ▪p < 0.05 vs. CN group, ≠p < 0.05 vs. epigallocatechin-3-gallate 40 mg/kg (EG 40) + CN group.
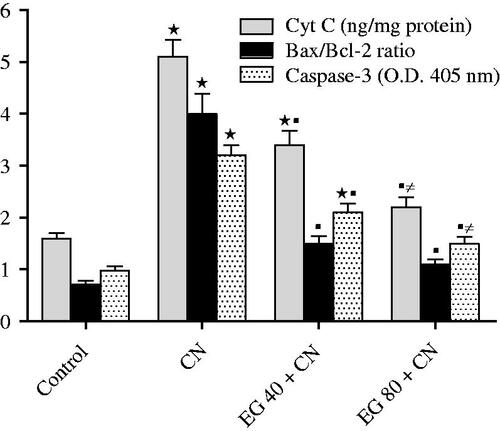
Figure 3. H&E (200×) photomicrographs of rat testes from: (a) control group showing normal testicular structure; (b) cisplatin (CN) group showing necrosis of seminiferous tubular cells, desquamation of tubular epithelium (black arrow), vacuolization (black head), absence of spermatogenesis, oedema of interstitium (white arrow); (c and d) Epigallocatechin-3-gallate 40 mg/kg (EG 40) + CN, and EG 80 mg/kg (EG 80) + CN, respectively, showing marked improvement with minimal damage; (e) spermatogenesis score; (f) testicular injury score. Results are mean ± S.E.M., *p < 0.05 vs. control group, ▪p < 0.05 vs. CN group.
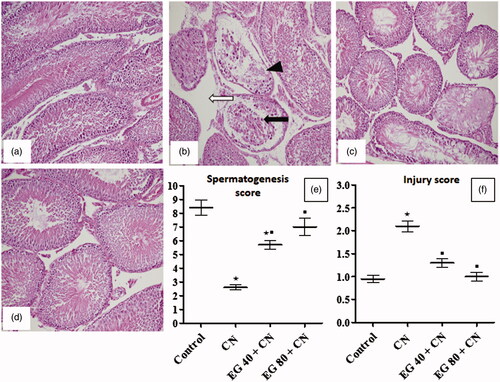
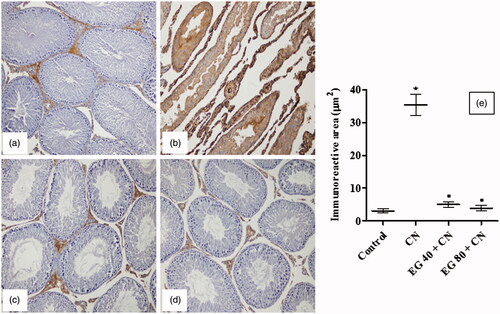
Figure 4. Immunohistochemistry (200×) of tumour necrosis factor-α (TNF-α) in rat testes from: (a) control group with minimal TNF-α expression; (b) cisplatin (CN) group showing a significant elevation of TNF-α reactivity; (c and d) epigallocatechin-3-gallate 40 mg/kg (EG 40) + CN, and EG 80 mg/kg (EG 80) + CN, respectively, showing significant decreases in TNF-α positivity; (e) immunoreactive area (μm2). Results are mean ± S.E.M., *p < 0.05 vs. control group, ▪p < 0.05 vs. CN group.