Figures & data
Figure 1. Effects of rosmarinic acid (RA) administration on serum ALT and AST in control (Cont), RA 10 mg/kg-treated control (Cont + RA10), RA 50 mg/kg-treated control (Cont + RA50), RA 100 mg/kg-treated control (Cont + RA100), acetaminophen (APAP), RA 10 mg/kg-treated APAP (APAP + RA10), RA 50 mg/kg-treated APAP (APAP + RA50) and RA 100 mg/kg-treated APAP (APAP + RA100) groups (n = 7) at the end of experiment. The data are represented as mean ± S.E.M. *p < 0.05 and ***p < 0.001 (as compared to control group).
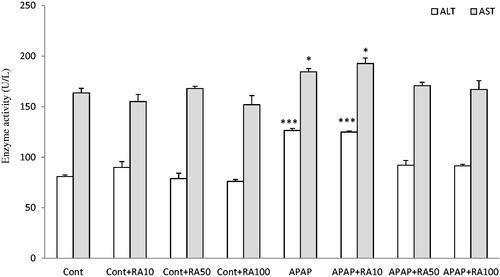
Figure 2. Effects of rosmarinic acid (RA) administration on serum albumin and total protein in control (Cont), RA 10 mg/kg-treated control (Cont + RA10), RA 50 mg/kg-treated control (Cont + RA50), RA 100 mg/kg-treated control (Cont + RA100), acetaminophen (APAP), RA 10 mg/kg-treated APAP (APAP + RA10), RA 50 mg/kg-treated APAP (APAP + RA50) and RA 100 mg/kg-treated APAP (APAP + RA100) groups (n = 7) at the end of experiment. The data are represented as mean ± S.E.M. ***p < 0.001 (as compared to control group).
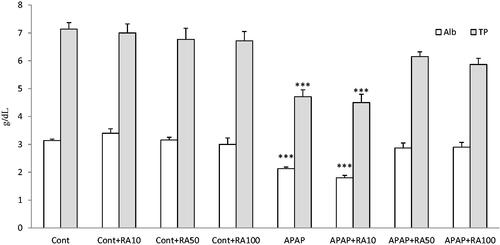
Figure 3. Effects of rosmarinic acid (RA) administration on the liver weight in control (Cont), RA 10 mg/kg-treated control (Cont + RA10), RA 50 mg/kg-treated control (Cont + RA50), RA 100 mg/kg-treated control (Cont + RA100), acetaminophen (APAP), RA 10 mg/kg-treated APAP (APAP + RA10), RA 50 mg/kg-treated APAP (APAP + RA50) and RA 100 mg/kg-treated APAP (APAP + RA100) groups (n = 7) at the end of experiment. The data are represented as mean ± S.E.M. *p < 0.05 and **p < 0.001 (as compared to control group).
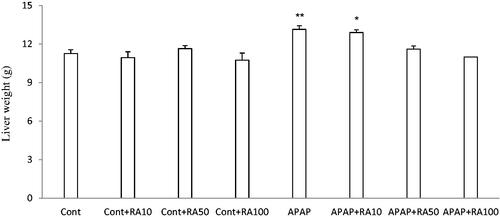
Table 1. Effects of rosmarinic acid (RA) administration on hepatic MDA, GSH, FRAP, GST and CYP2E1 activity in control (Cont), RA 10 mg/kg-treated control (Cont + RA10), RA 50 mg/kg-treated control (Cont + RA50), RA 100 mg/kg-treated control (Cont + RA100), acetaminophen (APAP), RA 10 mg/kg-treated APAP (APAP + RA10), RA 50 mg/kg-treated APAP (APAP + RA50) and RA 100 mg/kg-treated APAP (APAP + RA100) groups at the end of experiments (n = 7). The data are represented as mean ± S.E.M.
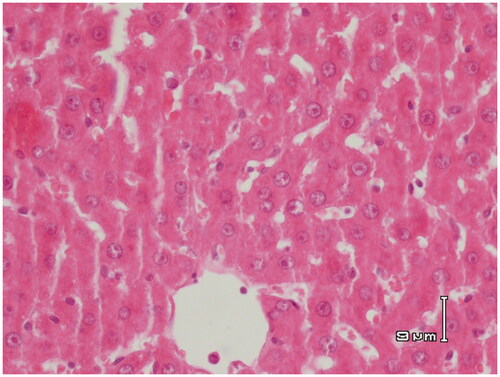
Figure 4. Paraffin sections stained by haematoxylin and eosin (H&E) for histopathological examination of liver tissues of rats as follows: (A) the control rats; (B) rats fed with RA (10 mg/kg); (C) rats fed with RA (50 mg/kg) and (D) rats fed with RA (100 mg/kg). Normal histological structures are depicted in these pictures.
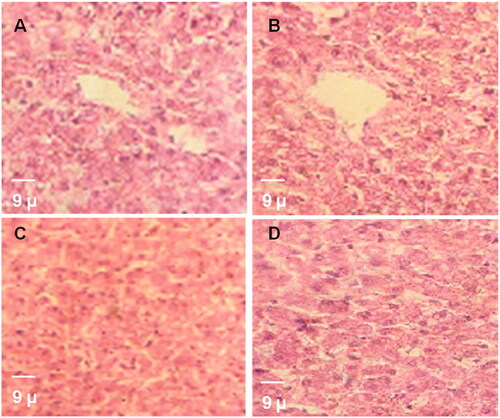
Figure 5. Paraffin sections stained by haematoxylin and eosin (H&E) for histopathological examination of liver tissues of rats treated with APAP (500 mg/kg). The arrows indicate haemorrhage in hepatic parenchyma. Circle shows inflammatory cell infiltrations and asterisks indicate hepatic cell necrosis.
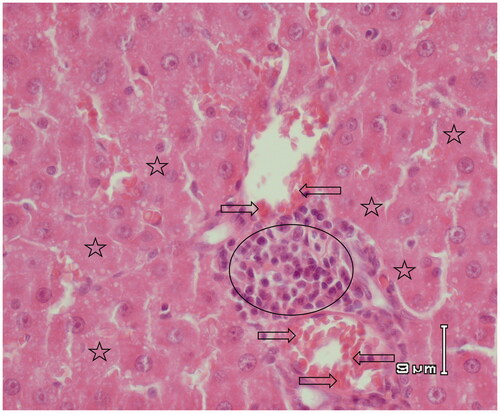
Figure 6. Paraffin sections stained by haematoxylin and eosin (H&E) for histopathological examination of liver tissues of rats treated with APAP (500 mg/kg) and RA (10 mg/kg). There are still some regions of injury induced by APAP. Circles show inflammatory cell infiltrations and asterisks indicate hepatic cell necrosis.
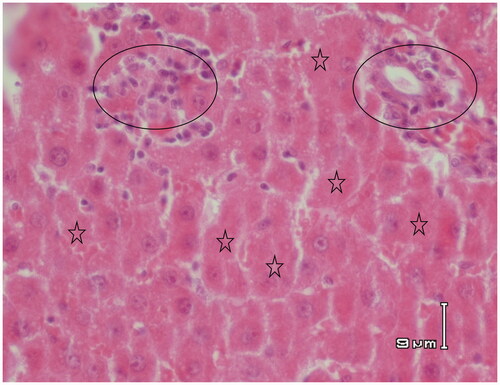
Figure 7. Paraffin sections stained by haematoxylin and eosin (H&E) for histopathological examination of liver tissues of rats treated with APAP (500 mg/kg) and RA (50 mg/kg). There are some regions of recovery and only apoptotic cells can be seen that are depicted with A letter (apoptosis).
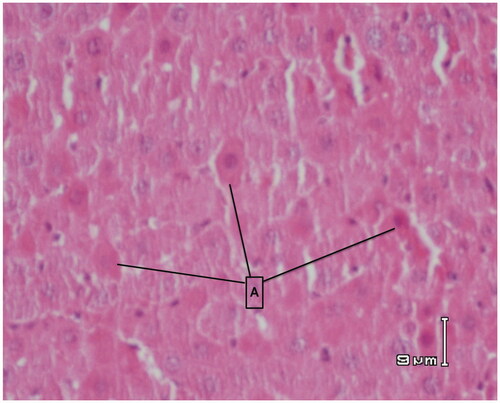
Figure 8. Paraffin sections stained by haematoxylin and eosin (H&E) for histopathological examination of liver tissues of rats treated with APAP (500 mg/kg) and RA (100 mg/kg). RA 100 mg/kg restored the normal architecture of the hepatic lobules and the hepatocytes.