Figures & data
Figure 1. Effect of various concentrations of GLA on the formation of AGEs. The data are expressed as mean ± SEM (n = 6) of fluorescence intensity, which co-relates with the production of AGEs. The GLA (0.1, 0.2, 0.4, 2, 10, 20 and 24 μM) appeared to be more effective in reducing the AGE formation at lower doses. The positive control (aminoguanidine) also exhibited the decline in the production of AGEs.
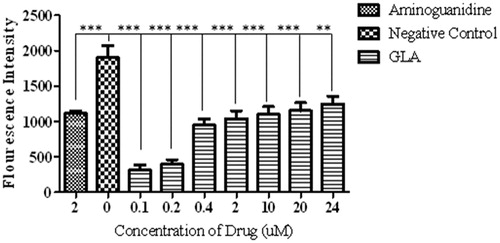
Figure 2. Comparison of escape latencies among various treatment groups during familiarization/acquisition trials in Morris water maze. The figure depicts the escape latency in a) vehicle control group, b) fructose group, c) GLA (1 mg/kg), d) GLA (5 mg/kg) and e) GLA (15 mg/kg). The vehicle group showed significant decline in the escape latency with the number of days, which is suggestive of the learning and memorization of spatial information. Among all groups, similar pattern was only observed in the GLA (1 mg/kg) group.
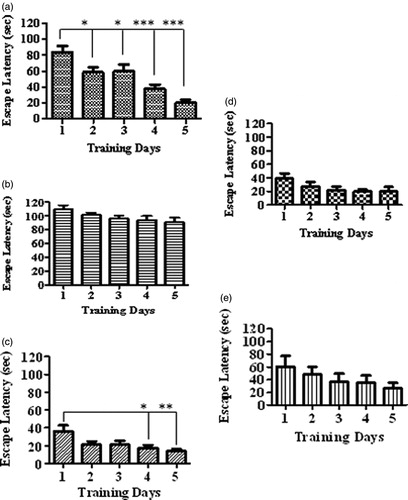
Figure 3. Effect of GLA on the time spent in the target quadrant during probe trial. The data are expressed as mean ± SEM (n = 6). The fructose treatment has significantly decreased the time spent in the target quadrant, which was significantly reversed by GLA at 1 mg/kg.
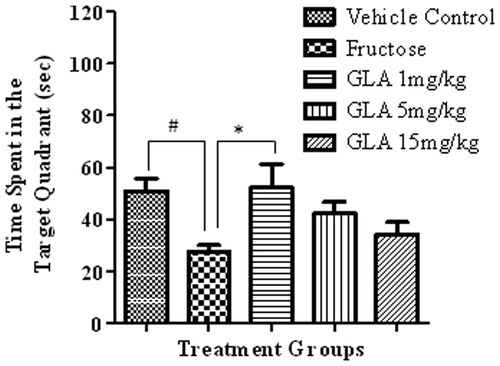
Figure 4. Comparison of the movement pattern of different treatment groups in probe trial. Quadrant 1 was the starting quadrant while quadrant 4 was the target quadrant. (A) Movement pattern of the vehicle control group. (B) Movement pattern of the fructose group animals (treated with d-fructose 1000 mg/kg (i.p.) plus 10% in drinking water). (C), (D) and (E) are movement pattern of rats treated with GLA 1, 5 and 15 mg/kg, respectively.
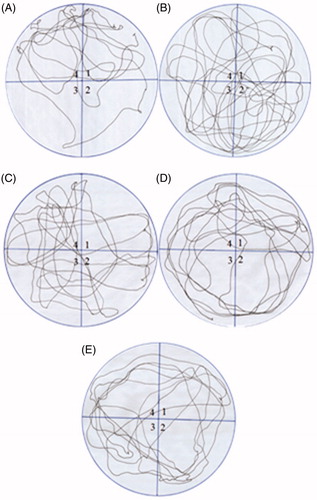
Figure 5. Effect of GLA on the number crossings through platform position in the probe trial. The data are expressed as mean ± SEM (n = 6). The fructose treatment has significantly reduced the number of crossing through platform position, which was significantly reversed by GLA (1 mg/kg).
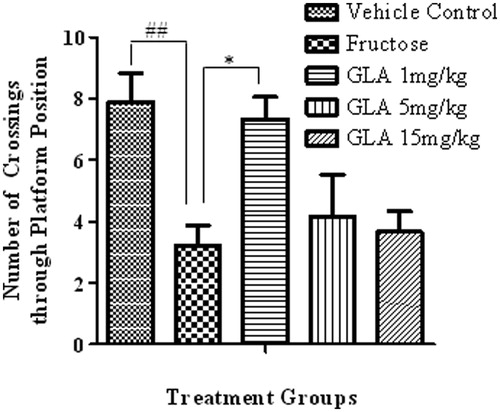
Figure 6. Effect of GLA on the latency to enter target quadrant in probe trial. The data are expressed as mean ± SEM (n = 6). The fructose treatment has significantly increased the latency to enter target quadrant, which was significantly reversed by GLA (1 mg/kg).
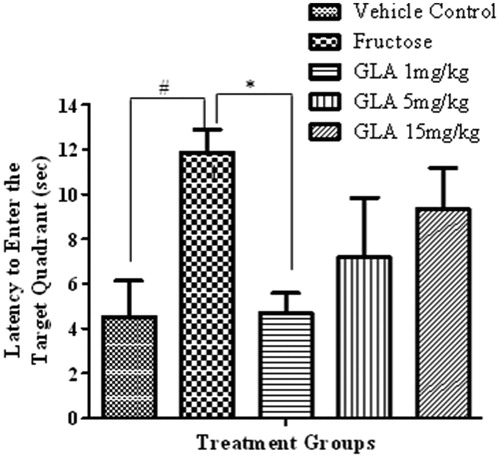
Figure 7. Effect of the various treatments on the locomotor activity of rats. The data are expressed as mean ± SEM (n = 6). None of the aforementioned treatment showed significant alterations.
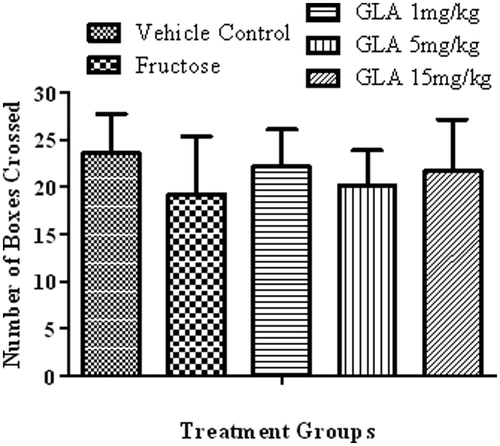
Figure 8. Effect of GLA on the HbA1c levels in the blood. The data are expressed as mean ± SEM of percentage HbA1c levels (n = 6). The fructose treatment has significantly increased the HbA1c levels, which was significantly reversed by the GLA (1 and 5 mg/kg).
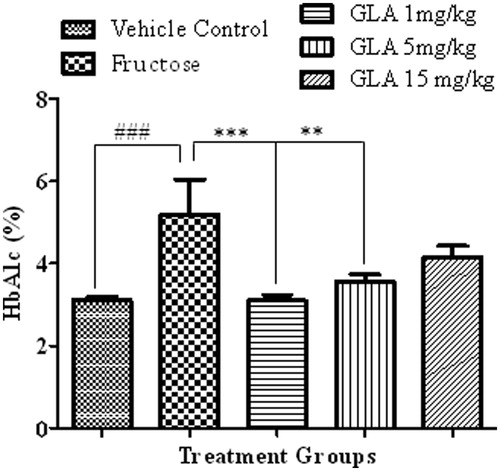
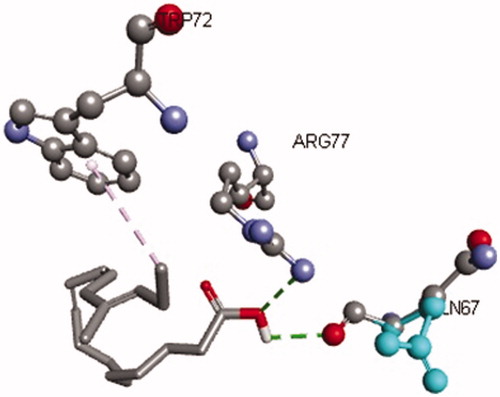
Figure 9. Interaction of GLA with active site residues of the RAGE receptor. The figure depicts hydrogen bonding (green dotted lines) of GLA with Arg77, and Gln67 residues and hydrophobic interaction (grey dotted lines) with Try72 of the binding site of RAGE.