Figures & data
Table. 1. Components of Ojayeonjonghwan (OJ)
Figure 1. OJ inhibited NO generation and iNOS induction. Cells (5 × 10⁵ cells/well) were treated with OJ for 1 h and then treated with LPS (1 μg/mL) for 48 h. Nitrite concentrations were measured in cell supernatants using the Griess method (A). Cells (5 × 10⁶ cells/well) were treated with OJ for 1 h and then treated with LPS (1 μg/mL) for 24 h. The mRNA and protein expressions of iNOS were measured by RT-PCR (B) and Western blot analysis (C). Cell viability was determined using a MTT assay (D). #p < 0.05, significantly different from non-treated cells. ∗p < 0.05, significantly different from LPS-stimulated cells. B: non-treated cells.
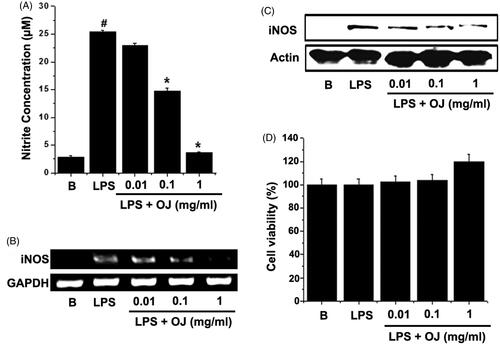
Figure 2. Effect of OJ on the COX-2 induction. Cells (5 × 10⁶ cells/well) were treated with OJ for 1 h and then treated with LPS (1 μg/mL). The mRNA and protein expressions of COX-2 were measured by using RT-PCR (A) and Western blot analysis (C). Relative mRNA (B) and protein (D) levels were quantitated by densitometry. B: non-treated cells.
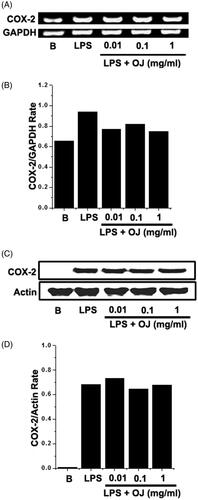
Figure 3. OJ suppressed TNF-α, IL-6, and IL-1β production and mRNA induction. Cells (5 × 10⁵ cells/well) were treated with OJ (0.01, 0.1, and 1 mg/mL) for 1 h and then treated with LPS (1 μg/mL) for 24 h. The productions of TNF-α (A), IL-6 (B), and IL-1β (C) in cell supernatants were measured by ELISA. The mRNA expression was measured by RT-PCR (D). Results are presented as the means ± SEM of three independent experiments. #p < 0.05, significantly different from non-treated cells. ∗p < 0.05, significantly different from LPS-stimulated cells. B: non-treated cells.
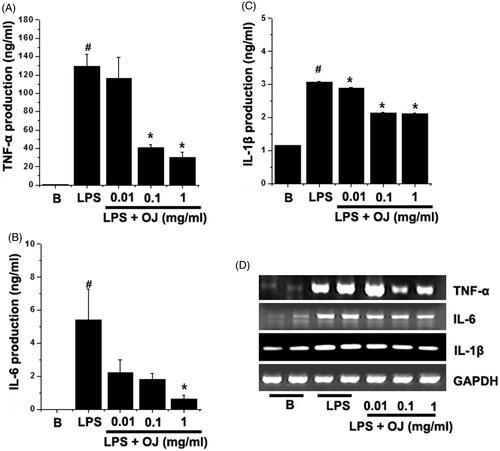
Figure 4. OJ inhibited activation of NF-κB. Cells (5 × 10⁶ cells/well) were treated with OJ (0.01, 0.1, and 1 mg/mL) for 1 h and then stimulated by LPS (1 μg/mL) for 2 h. NF-κB and phosphorylated IκB-α were determined by Western blot analysis (A). NF-κB was stained using a primary anti-p65 for 1 h and then incubated with secondary TRITC-conjugated IgG for 1 h (B). B: non-treated cells. NE: nuclear extract; CE: cytoplasmic extract; PARP: poly(ADP-ribose) polymerase-1.
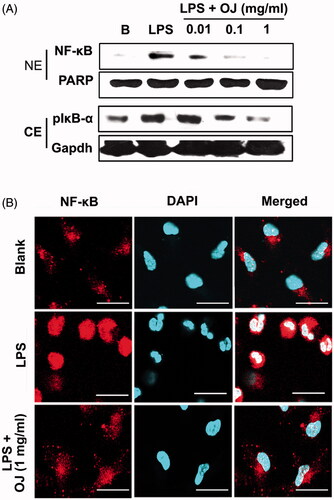
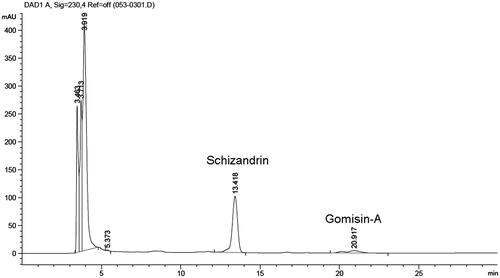
Figure 5. HPLC chromatogram of OJ. The chromatogram was obtained by monitoring absorbance at 230 nm.