Figures & data
Figure 1. Effect of 10 days daily oral administration of N-acetylcysteine and saponin on hepatocyte integrity loss markers in normal rats.
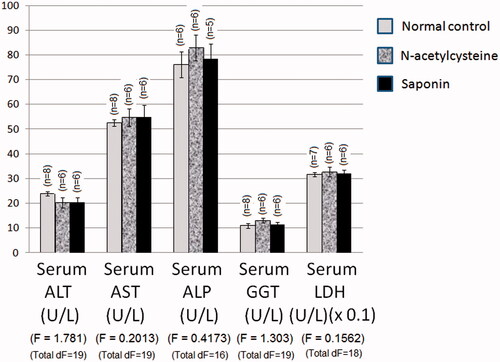
Table 1. Effect of 10 days daily oral administration of N-acetylcysteine and saponin on hepatocyte integrity loss markers in rats with ferrous sulphate-induced hepatotoxicity.
Figure 2. Effect of 10 days daily oral administration of N-acetylcysteine and saponin on nitro-oxidative stress markers in normal rats.
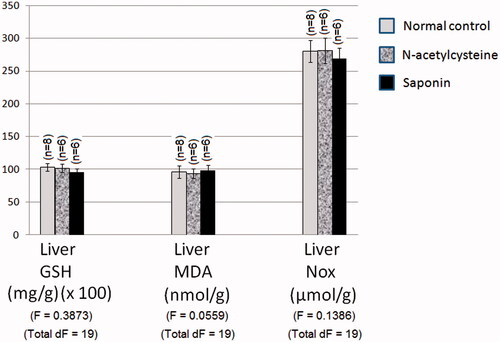
Table 2. Effect of 10 days daily oral administration of N-acetylcysteine and saponin on nitro-oxidative stress markers in rats with ferrous sulphate-induced hepatotoxicity.
Figure 3. Effect of 10 days daily oral administration of N-acetylcysteine and saponin on dyslipidaemia markers in normal rats.
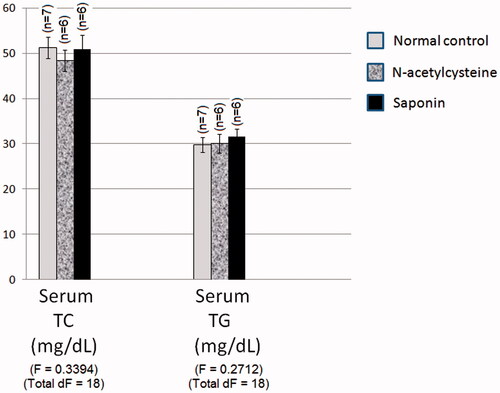
Table 3. Effect of 10 days daily oral administration of N-acetylcysteine and saponin on dyslipidaemia markers in rats with ferrous sulphate-induced hepatotoxicity.
Figure 4. Effect of 10 days daily oral administration of N-acetylcysteine and saponin on functional markers in normal rats.
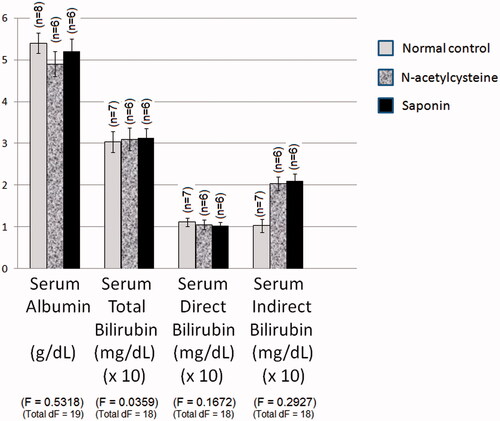
Table 4. Effect of 10 days daily oral administration of N-acetylcysteine and saponin on functional markers in rats with ferrous sulphate-induced hepatotoxicity.
Figure 5. Photomicrographs of liver section obtained from different groups (H&E; 400×), where (A) normal control group showing normal hepatic architecture with central vein (CV) and radiating cords of normal hepatocytes (H) with central rounded vesicular nuclei and prominent nucleoli. Hepatic cords are separated by blood sinusoids (S) lined with endothelium and von Kupffer cells (blue arrow); (B) ferrous sulphate group showing dilated congested central vein (CV) with congested blood sinusoids (S). Massive fatty infiltration of hepatocytes (H) with some hepatocytes acquired the signet ring appearance (blue arrow); (C) N-acetylcysteine plus ferrous sulphate group showing congested central vein (CV). Normal hepatocytes (H) are separated by slightly dilated congested blood sinusoids (S) with activated von Kupffer cells (blue arrow). Binucleated cells (black arrow) can be seen; (D) saponin plus ferrous sulphate group showing congested central vein (CV). Normal hepatocytes (H) are separated by slightly dilated congested blood sinusoids (S) with activated von Kupffer cells (blue arrow). Binucleated cells (black arrow) can be seen.
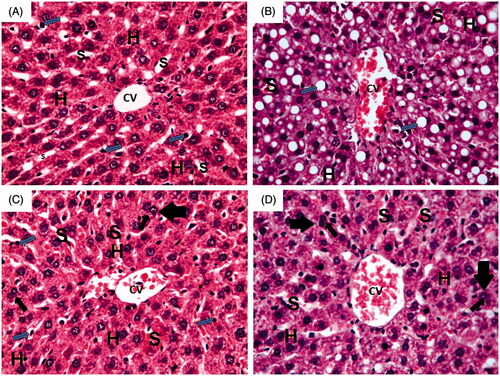
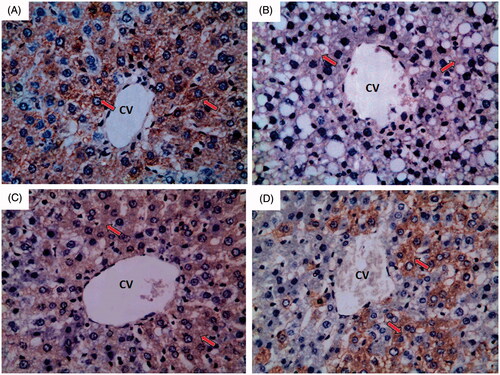
Figure 6. Photomicrographs of liver sections obtained from different groups (iNOS immunohistochemical stain; 400×), where (A) normal control group showing weak immunoreactivity to iNOS which appears as faint brown colour (red arrow); (B) ferrous sulphate group showing strong immunoreactivity to iNOS which appears as brown colour (red arrow) with some areas of intense immunoreactivity (yellow arrow); (C) N-acetylcysteine plus ferrous sulphate group showing mild immunoreactivity to iNOS which appears as brown colour (red arrow); (D) saponin plus ferrous sulphate group showing moderate immunoreactivity to iNOS which appears as brown colour (red arrow).
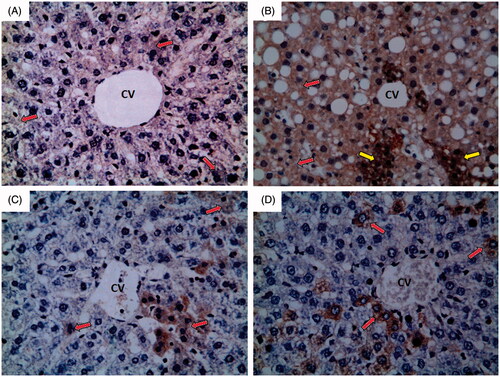
Figure 7. A photomicrograph of liver section obtained from different groups (eNOS immunohistochemical stain; 400×), where (A) normal control group showing strong immunoreactivity to eNOS which appears as brown colour (red arrow); (B) ferrous sulphate group showing weak to negative immunoreactivity to eNOS which appears as brown colour (red arrow); (C) N-acetylcysteine plus ferrous sulphate group showing strong immunoreactivity to eNOS which appears as brown colour (red arrow) but not as normal control group; (D) saponin plus ferrous sulphate group showing moderate immunoreactivity to eNOS which appears as brown colour (red arrow).