
Figures & data
Figure 1. DPPH-free radical scavenging activity of (A) gallic acid (standard) and (B) turmeric extract.
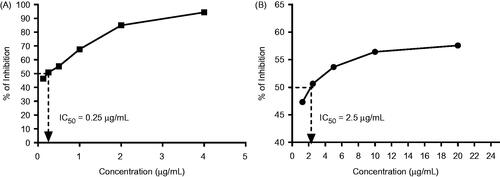
Table 1. The effects of turmeric and CF on BW and relative organ weights.
Table 2. The effects of turmeric and CF administration on the erythrocytes count in rats.
Table 3. The effects of turmeric and CF administrations on the total and differential leucocytes count in rats.
Table 4. The effects of turmeric and CF administrations on the platelets count in rats.
Table 5. Semi-quantitative scoring of the architectural changes following the histopathological examination of the rat liver.
Figure 2. The effects of turmeric and CF on serum hepatic marker enzyme activities. Data are expressed as mean ± SD of seven animals per group. The bars with different superscript (a, b) denote significance differences based on an one-way ANOVA followed by Tukey’s multiple comparison tests.
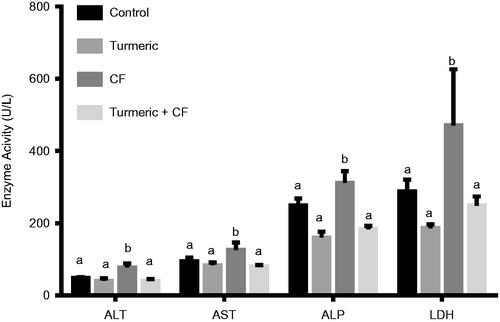
Figure 3. The effects of turmeric and CF on serum cholesterol levels. Data are expressed as mean ± SD of seven animals per group. The bars with different superscript (a, b, c) denote significance differences based on an one-way ANOVA followed by Tukey’s multiple comparison tests.
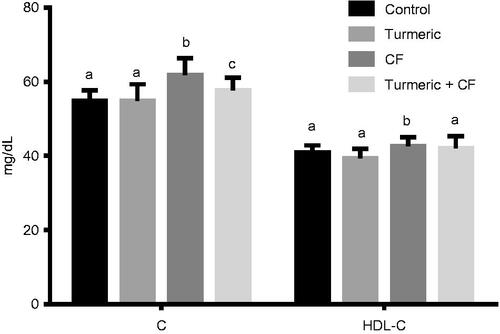
Figure 4. The effects of turmeric and CF on liver LPO levels in normal and different treated rats. Data are expressed as mean ± SD of seven animals per group. The bars with different superscript (a, b, c) denote significance differences based on an one-way ANOVA followed by Tukey’s multiple comparison tests.
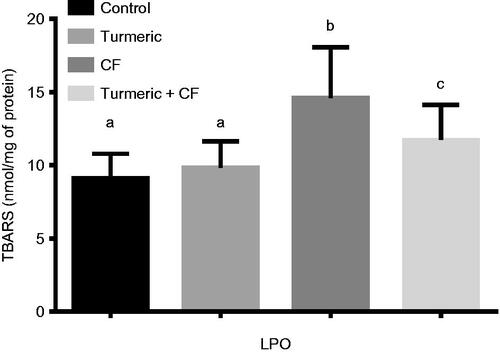
Figure 5. The effects of turmeric and CF on the activities of (A) superoxide dismutase (SOD) and (B) glutathione peroxidase (GSH-PX) in the liver tissue of normal and treated rats. Data are expressed as mean ± SD of seven animals per group. The bars with different superscript (a, b, c) denote significance differences based on an one-way ANOVA followed by Tukey’s multiple comparison tests.
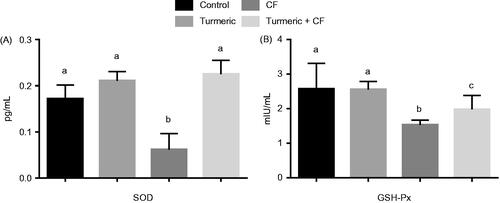
Figure 6. Photomicrographs of H & E (hematoxylin and eosin) stained sections of the liver of control rats and the rats treated with turmeric alone showing (A & B) normal histological structure of the central vein (CV) and surrounding hexagonal hepatocytes. (C) CF-treated rat livers showed severe disruption of the cellular arrangement radiating from the central vein (CV) and in the lobule (long black arrows), degeneration of hepatocytes at the peripheral area of the CV (short black arrows) and congestion in the CV associated with inflammatory infiltrates (white arrows). (D) A liver section of the animals treated with turmeric +CF, showing a remarkable degree of preservation in the cellular arrangement with only mild inflammation observed. [Magnification: 40X].
![Figure 6. Photomicrographs of H & E (hematoxylin and eosin) stained sections of the liver of control rats and the rats treated with turmeric alone showing (A & B) normal histological structure of the central vein (CV) and surrounding hexagonal hepatocytes. (C) CF-treated rat livers showed severe disruption of the cellular arrangement radiating from the central vein (CV) and in the lobule (long black arrows), degeneration of hepatocytes at the peripheral area of the CV (short black arrows) and congestion in the CV associated with inflammatory infiltrates (white arrows). (D) A liver section of the animals treated with turmeric +CF, showing a remarkable degree of preservation in the cellular arrangement with only mild inflammation observed. [Magnification: 40X].](/cms/asset/ecc0d025-8b84-42e4-b061-51c96b0a402e/iphb_a_1345951_f0006_c.jpg)