
Figures & data
Figure 1. Proposed chemical structures of tentatively identified molecules in papaya leaf aqueous extract.
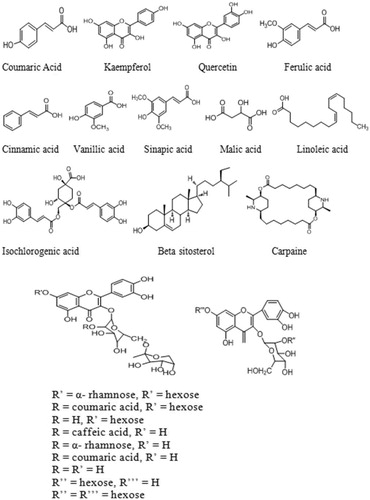
Figure 2. Developed HPTLC plate showing spots of myricetin, trans-ferulic acid, caffeic acid, and kaempferol at different concentrations in standards and in samples (1: mother extract) at 254 nm (A), HPTLC chromatogram of sample showing peaks of myricetin, trans-ferulic acid, caffeic acid, and kaempferol (B).
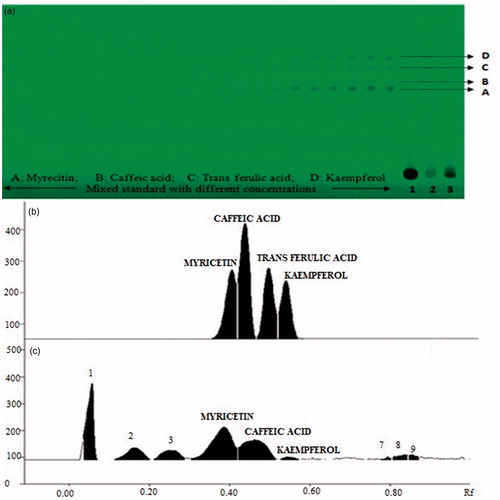
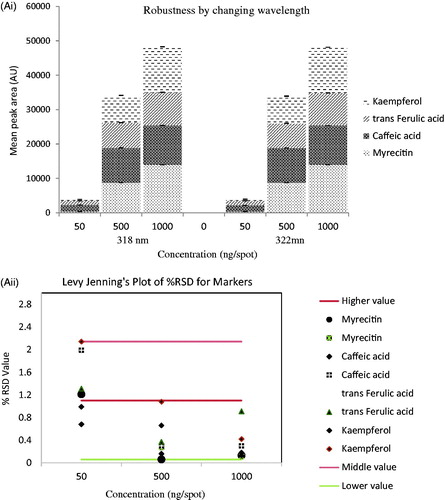
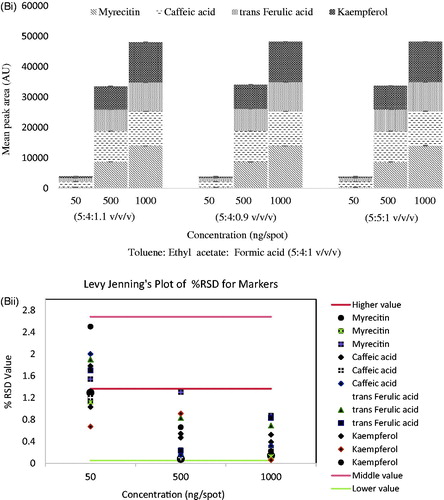
Table 1. Linearity and validation data of chromatographic HPTLC method for mixed standards (n = 3).
Figure 4. UPLC chromatogram of C. papaya leaf (A), mass spectra of C. papaya leaf aqueous extract at 320 nm in ESI+ mode (B).
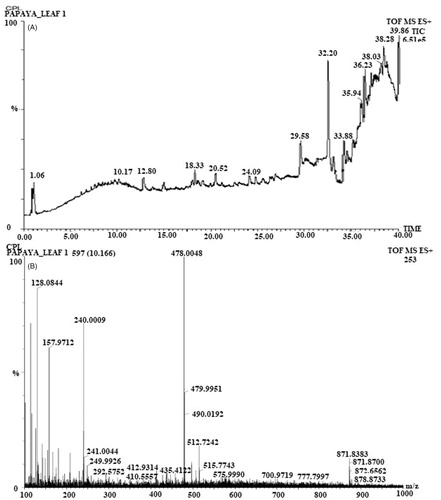
Figure 5. Proposed fragmentation of cinnamic acid derivatives (A) and quercetin derivatives (B) tentatively identified in papaya leaf aqueous extract.
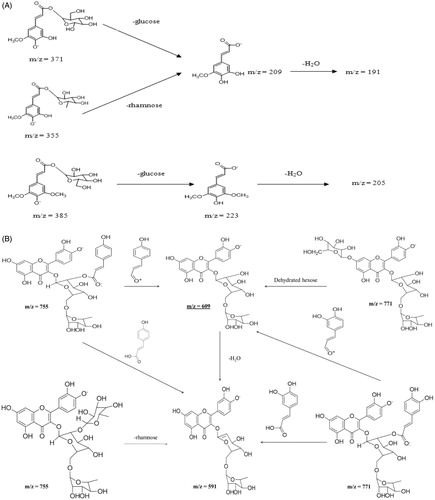
Table 2. Tentatively identified phenolics and flavonoids in C. papaya leaf aqueous extract by UPLC-qTOF/MS.
Figure 6. (A) Effect on blood for platelet count against cyclophosphamide after oral administration of SCPLE; (B) effect of aqueous extract of C. papaya leaf on delayed-type hypersensitivity. (All values are expressed as mean ± SEM (n = 6)). *** indicates p < 0.001 extremely significant, ** indicates p < 0.01 highly significant, * indicates p < 0.05 significant, and ns indicates p > 0.05 nonsignificant when compared with toxic control group where GP: group; CYP: cyclophosphamide; CPL1:C. papaya leaf (dose 50 mg/kg); CPL2: C. papaya leaf (150 mg/kg).
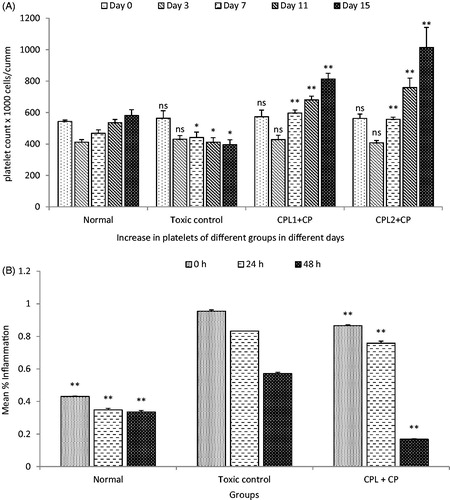
Figure 7. (A) Effect of standardized aqueous plant extract and cyclophosphamide on monocyte, basophils, and eosinophils; (B) effect of standardized aqueous plant extract and cyclophosphamide on lymphocyte and neutrophils. All values are expressed as mean ± SEM (n = 6). *** indicates p < 0.001 extremely significant, ** indicates p < 0.01 highly significant, * indicates p < 0.05 significant, and ns indicates p > 0.05 nonsignificant when compared with toxic control group, where group 1: normal; group 2: negative control receiving cyclophosphamide; group 3: treatment group receiving C. papaya leaf (dose 50 mg/kg); group 4: treatment group receiving C. papaya leaf (150 mg/kg).
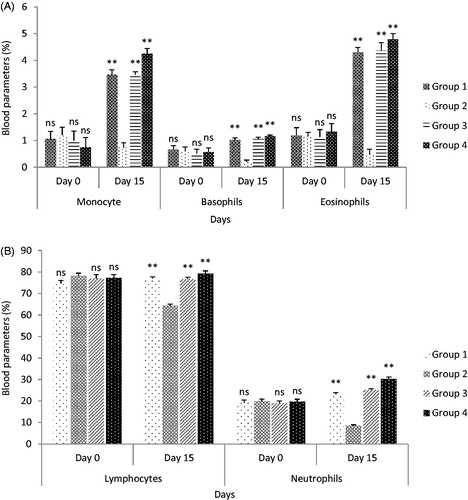
Figure 8. Effect on bleeding time and clotting time after oral administration. All values are expressed as mean ± SEM (n = 6). *** indicates p < 0.001 extremely significant, ** indicates p < 0.01 highly significant, * indicates p < 0.05 significant, and ns indicates p > 0.05 nonsignificant when compared with toxic control group, where group 1: normal; group 2: negative control receiving cyclophosphamide; group 3: treatment group receiving C. papaya leaf (dose 50 mg/kg); group 4: treatment group receiving C. papaya leaf (150 mg/kg).
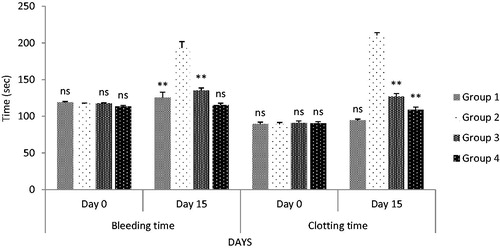
Figure 9. (i) Histopathology of spleen: (a) histology of spleen from normal group showing normal fibrosis thickening; (b) normal clarification of cells; (c) toxic control group showing fibrosis capsular thickening and increase in cytoplasmic vacuolation at focal places; (d) decreased EMH release; (e) increased cellularity in white pulp; (f) treatment group showing minimal or no cytoplasmic vacuolation at focal places with less fibrosis thickening; (g) enlarged cell size at focal places and maximum EMH release; (h) normal cellularity in white pulp; (ii) histopathology of liver: (a) histology of liver from normal control showing normal cell size, hepatocytes, less cytoplasmic vacuolation, normal fibrosis thickening, cytocidal space is also less; (b) histology from toxic control (thrombocytopenic) group showing large sinusoidal space; (c) degeneration of cytoplast and maximal fibrosis capsular thickening; (d) maximum density of cells; (e) histology from treatment group showing maximal EMH release; (f) degeneration of cytoplast and scattered fibrosis capsular thickening.
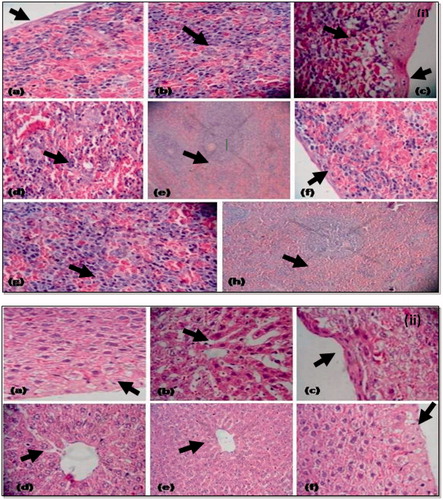
Table 3. Effect of C. papaya leaf on total leucocyte count, in vivo carbon clearance test and cyclophosphamide-induced neutropenia, haemagglutination antibody titre, and pro-inflammatory cytokine production in cyclophosphamide-treated animals.