Figures & data
Figure 1. Effect of pretreatment of rats with EthE (30–300 mg/kg, p.o.) and morphine (3 mg/kg, i.p.) on TNF-α-induced hypernociception. Each datum represents the mean of five animals and the error bars indicate SEM. The symbols * and † indicate significance levels compared to respective control groups: (a) represent the time-course curves ***p < 0.001, **p < 0.01 (two-way ANOVA followed by Bonferroni’s post hoc test), whereas (b) represents total anti-nociceptive effects (AUC) ††p < 0.01 and †p < 0.05 (one-way ANOVA followed by Newman–Keuls post hoc test).
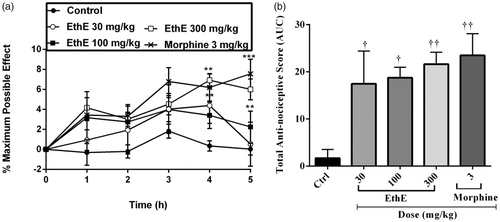
Figure 2. Effect of pretreatment of rats with EthE (30–300 mg/kg, p.o.) and morphine (3 mg/kg, i.p.) on IL-1β-induced hypernociception. Each datum represents the mean of five animals and the error bars indicate SEM. The symbols * and † indicate significance levels compared to respective control groups: (a) represents the time-course curves **p < 0.01, *p < 0.05 (two-way ANOVA followed by Bonferroni’s post hoc test), whereas (b) represents total anti-nociceptive effects (AUC) ††p < 0.01 and †p < 0.05 (one-way ANOVA followed by Newman–Keuls post hoc test).
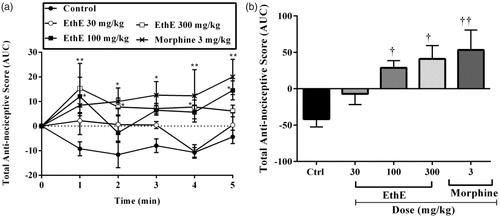
Figure 3. Effect of pretreatment of rats with EthE (30–300 mg/kg, p.o.) and morphine (3 mg/kg, i.p.) on bradykinin-induced hypernociception. Each datum represents the mean of five animals and the error bars indicate SEM. The symbols * and † indicate significance levels compared to respective control groups: (a) represents the time-course curves ***p < 0.001, **p < 0.01, *p < 0.05 (two-way ANOVA followed by Bonferroni’s post hoc test), whereas (b) represents total anti-nociceptive effects (AUC) †††p < 0.001 and ††p < 0.01 (one-way ANOVA followed by Newman–Keuls post hoc test).
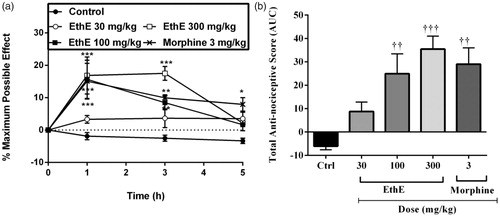
Figure 4. Effect of pretreatment of rats with EthE (30–300 mg/kg, p.o.), morphine (3 mg/kg, i.p.) and diclofenac (10 mg/kg, i.p.) on PGE2-induced hypernociception. Each datum represents the mean of five animals and the error bars indicate SEM. The symbols * and † indicate significance levels compared to respective control groups: (a) represents the time-course curves **p < 0.01, *p < 0.05 (two-way ANOVA followed by Bonferroni’s post hoc test), whereas (b) represents total anti-nociceptive effects (AUC) ††p < 0.01 (one-way ANOVA followed by Newman–Keuls post hoc test).
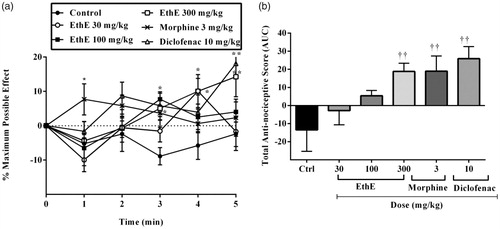
Figure 5. Effect of pretreatment of mice with (a) yohimbine (3 mg/kg, p.o.), (b) nifedipine (10 mg/kg, p.o.), (c) atropine (5 mg/kg, i.p.), (d) naloxone (2 mg/kg, i.p.), (e) granisetron (2 mg/kg, p.o.), (f) L-NAME (10 mg/kg, i.p.), (g) glibenclamide (8 mg/kg, p.o.) and (h) theophylline (10 mg/kg, i.p.) on the nociceptive scores of EthE (100 mg/kg, p.o.) on the time-course curves of formalin-induced nociceptive test. Each point represents the mean of five animals and the error bars indicate SEM. ***p < 0.001, **p < 0.01 and *p < 0.05 compared to the control group at same time points (two-way ANOVA followed by Bonferroni’s post hoc test).
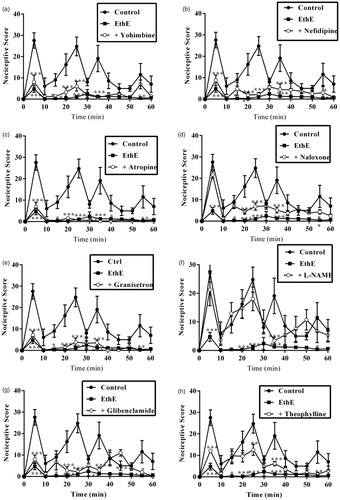
Figure 6. Effect of pretreatment of mice with yohimbine (3 mg/kg, p.o.), nifedipine (10 mg/kg, p.o.), atropine (5 mg/kg, i.p.), naloxone (2 mg/kg i.p.), granisetron (2 mg/kg, p.o.), L-NAME (10 mg/kg, i.p), glibenclamide (8 mg/kg, p.o.) and theophylline (10 mg/kg, i.p.) on the total nociceptive score of EthE (100 mg/kg, p.o.) in phase 1 and phase 2 of formalin-induced nociception. Each column represents the mean of five animals and the error bars indicate SEM. ***p < 0.001 compared to control group and †††p < 0.001, ††p < 0.01 and †p < 0.05 compared to EthE-alone-treated group (one-way ANOVA followed by Newman–Keuls post hoc test).
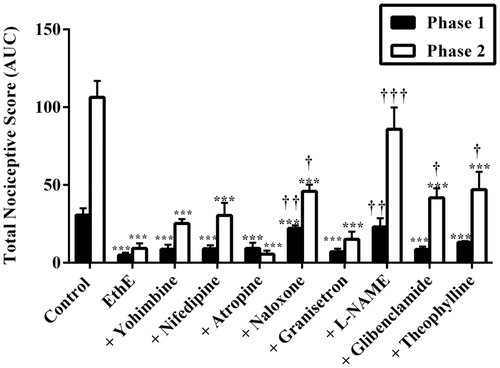
Figure 7. Effect of pretreatment of mice with (a) yohimbine (3 mg/kg, p.o.), (b) nifedipine (10 mg/kg, p.o.), (c) atropine (5 mg/kg, i.p.), (d) naloxone (2 mg/kg, i.p.), (e) granisetron (2 mg/kg, p.o.), (f) L-NAME (10 mg/kg, i.p.), (g) glibenclamide (8 mg/kg, p.o.) and (h) theophylline (10 mg/kg i.p.) on the total nociceptive score of morphine (3 mg/kg, i.p.) on the time-course curves of formalin-induced nociceptive test. Each point represents the mean of five animals and the error bars indicate SEM. ***p < 0.001, **p < 0.01 and *p < 0.05 compared the control group at same time points (two-way ANOVA followed by Bonferroni’s post hoc test).
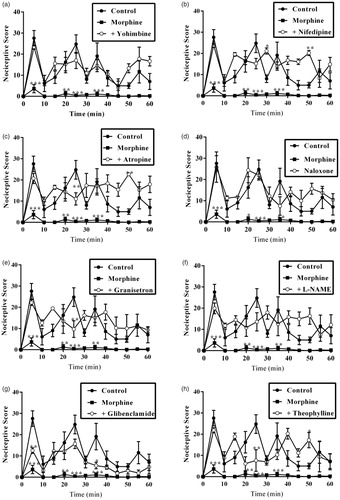
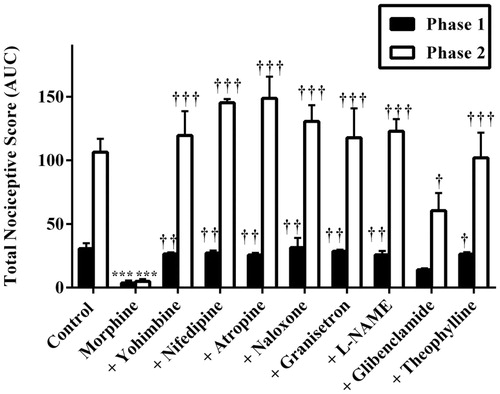
Figure 8. Effect of pretreatment of mice with yohimbine (3 mg/kg, p.o.), nifedipine (10 mg/kg, p.o.), atropine (5 mg/kg, i.p.), naloxone (2 mg/kg i.p.), granisetron (2 mg/kg, p.o.), L-NAME (10 mg/kg, i.p), glibenclamide (8 mg/kg, p.o.) and theophylline (10 mg/kg, i.p.) on the total nociceptive scores of morphine (3 mg/kg, i.p.) in phase 1 and phase 2 of formalin-induced nociception. Each column represents the mean of five animals and the error bars indicate SEM. ***p < 0.001 compared to control group and †††p < 0.001, ††p < 0.01 and †p ≤ 0.05 compared to morphine-alone-treated group (one-way ANOVA followed by Newman–Keuls post hoc test).