
Figures & data
Table 1. Effect of separate extract or ‘Contracept-TM’ of T. chebula, M. balbisiana or CPA on body weight, testiculo-somatic, epididymal somatic and seminal vesiculo-somatic indices in male rat.
Table 2. Cauda epididymal sperm count, motility, viability, levels of serum testosterone, testicular cholesterol and seminal vesicular fructose in separate extract or ‘Contracept-TM’ of T. chebula, M. balbisiana or CPA-treated group.
Figure 1. Activities of testicular Δ5, 3β-HSD and 17β-HSD after treatment with separate extract or ‘Contracept-TM’ of T. chebula, M. balbisiana or CPA. Bars expressed in terms of Mean ± SEM, n = 6. ‘ANOVA followed by Multiple Comparison Student’s two tail t-test’. Bars with different superscripts (a, b, c) differ from each other significantly, p < 0.05.
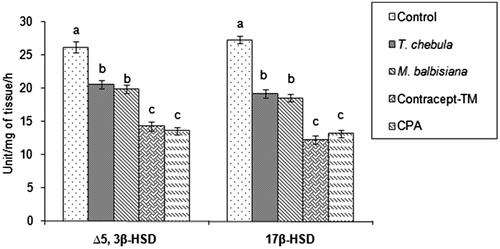
Figure 2. Catalase, peroxidase activities and levels of CD, TBARS in sperm pellet in T. chebula, M. balbisiana separate extract or ‘Contracept-TM’ or CPA-treated group. Bars expressed in terms of Mean ± SEM, n = 6. ‘ANOVA followed by Multiple Comparison Student’s two tail t-test’. Bars with different superscripts, i.e., (a, b, c, d) differ from each other significantly, p < 0.05.
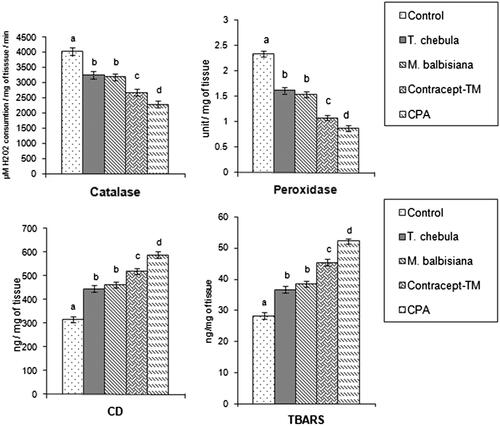
Figure 3. Histology of testis 400 X (Hematoxylin Eosin Stain). Representative microphotographs of a vehicle control (A), T. chebula (B), M. balbisiana (C), ‘Contracept-TM’ (D) and CPA (E) treated rat. Vehicle control group rat showed normal spermatogenesis at stage VII and STD. Different individual extract, ‘Contracept-TM’ and CPA-treated groups showed significant decrease in the number of different generations of germ cells at stage VII and STD in respect to the vehicle control group (p < 0.05).
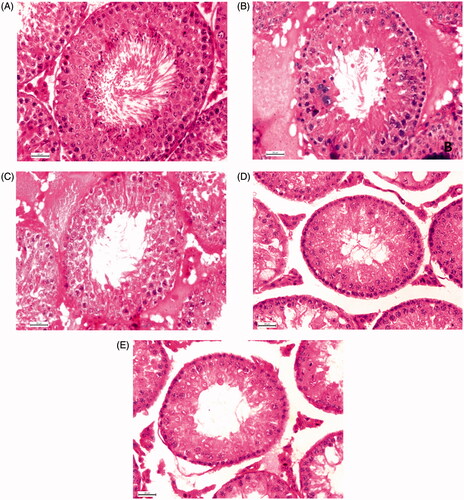
Table 3. Effect of T. chebula, M. balbisiana in separate extract or ‘Contracept-TM’ or CPA on the number of different generations of germ cells at stage VII of seminiferous epithelial cell cycle.