Figures & data
Figure 1. Total ion chromatograms of PFE in negative ESI mode.
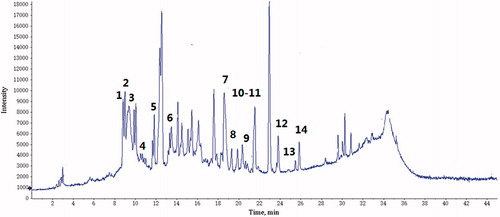
Table 1. Characterisation of compounds in PFE by HPLC-QTOF-MS/MS.
Figure 2. Cytotoxicity of PFE in RAW 264.7 cells. Cells were treated with different concentrations of PFE for 24 h, and viability was assayed by the MTT assay. Data represent mean values of triple determinations ± SEM. PFE at 100 μg/mL was not cytotoxic.
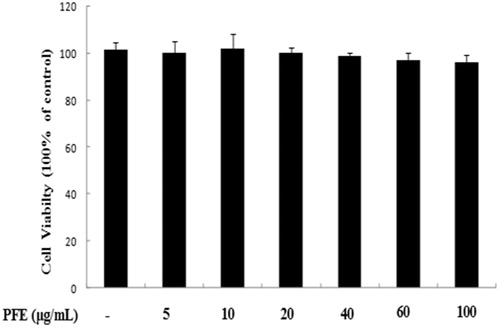
Figure 3. Effects of PFE on LPS-induced NO, PGE2 production and iNOS, COX-2 protein expression levels in LPS-induced RAW264.7 cells. Cells were incubated in the presence of PFE or in combination with 1 μg/mL LPS for 18 h. The culture supernatant was analyzed for NO (A), PGE2 (B) production. The iNOS and COX-2 (C) expression levels were determined by Western blotting. Data show mean ± SEM values of three independent experiments. *p < 0.05 and **p < 0.01 indicate significant differences from LPS-stimulation value.
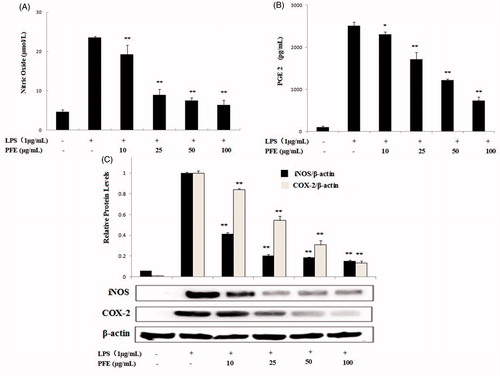
Figure 4. Effects of PFE on TNF-α (A), IL-6 (B) and IL-1β (C) in LPS-induced RAW264.7 cells. The cells were pretreated with the different concentrations of PFE for 1 h and then exposed to 1 μg/mL LPS for 18 h. The levels of TNF-α, IL-1β and IL-6 in the supernatant were determined by ELISA. Data show mean ± SEM values of three independent experiments. *p < 0.05 and **p < 0.01 indicate significant differences from LPS stimulation value.
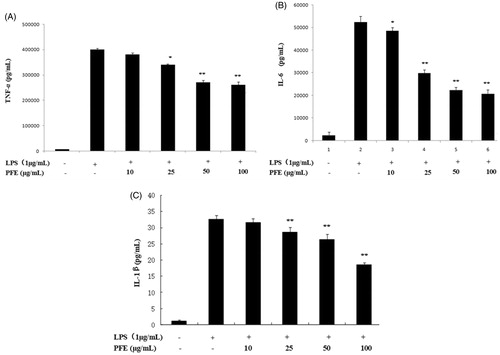
Figure 5. Effects of PFE on NF-κB p65 and IκBα activity in LPS-stimulated RAW 264.7 cells. The cells were pretreated with the different concentrations of PFE for 1 h and then exposed to 1 μg/mL LPS for additional 30 min. Cytoplasm and nuclear extracts proteins of cells were harvested for measurements of NF-κB p65 and IκB-α protein by Western blotting. β-Actin and Lamin B were used as the internal control. Data show mean ± SEM values of three independent experiments. *p < 0.05 and **p < 0.01 indicate significant differences from LPS-stimulation value.
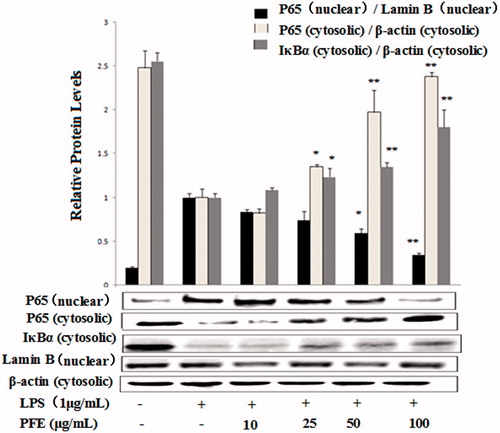
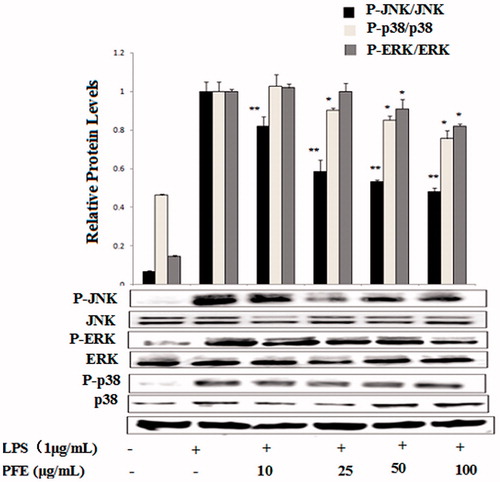
Figure 6. Effects of PFE on phosphorylation of MAPKs activity in LPS-stimulated RAW 264.7 cells. The cells were pretreated with the different concentrations of PFE for 1 h and then exposed to LPS for 30 min. Total cellular proteins of cells were harvested for measurements of total or phosphorylated ERK1/2, JNK, and p38 by Western blotting. Data show mean ± SEM values of three independent experiments. *p < 0.05 and **p < 0.01 indicate significant differences from LPS-stimulation value.