Figures & data
Figure 1. Timeline of experiments.
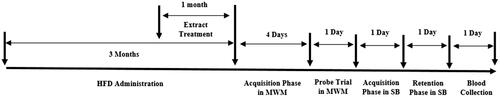
Table 1. The composition of the high-fat and standard diets.
Figure 2. (A) Serum cholesterol, (B) low-density lipoprotein (LDL), (C) triglyceride (TG) and (D) high-density lipoprotein (HDL) levels in the control, high-fat diet (HFD), extract (Ext) and HFD + Ext groups. The HFD and HFD + Ext groups showed higher cholesterol and LDL levels than the control group. ***Statistically significant differences in the HFD and HFD + Ext groups compared to the control group (p < 0.001). $$$Statistically significant differences between the HFD, HFD + Ext and extract groups (p < 0.001).
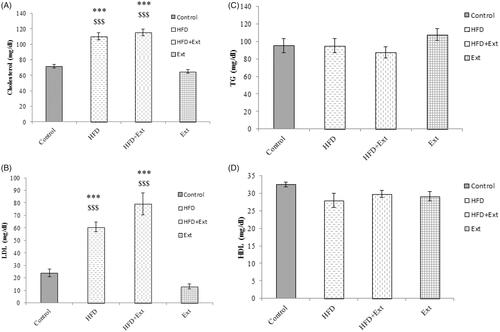
Figure 3. Number of trials to achieve learning in the passive avoidance test (A) step-through latency in the acquisition trial (STLa), (B) step-through latency in the retention trial (STLr) (C) time spent in the dark compartment (TDC) (D) of the passive avoidance learning test. Con = control group, Ext = extract group, HFD = High-fat diet group, HFD + Ext = High-fat diet + extract group. The HFD and extract groups showed statistically significant decreases in step-through latency in the retention test and statistically significant increases in TDC compared to the control group (**p < 0.01 and ***p < 0.001, respectively). The HFD + Ext group showed a statistically significant increase in step-through latency in the retention test compared to the HFD group (#p < 0.05; ##p < 0.01, respectively).
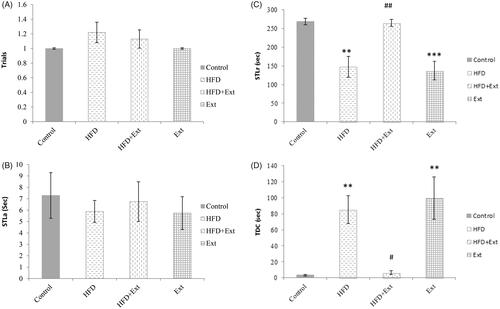
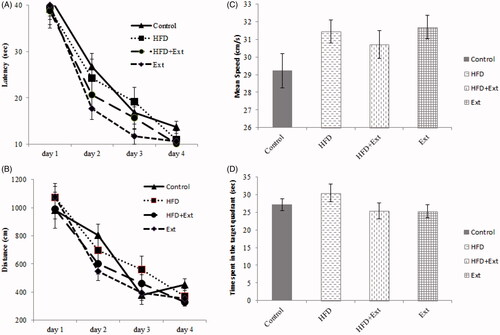
Figure 4. (A) Escape latency, (B) distance travelled, (C) mean swimming speed and (D) time spent in the target quadrant in the Morris water maze test. Con = control group, Ext = extract group, HFD = High-fat diet group, HFD + Ext = High-fat diet + extract group. There were no significant differences between groups.